Home Assistant -
HACS Kleenex Pollen Radar
![]()
Here you can find Home Assistant (lovelace) dashboard examples related to the custom HACS integration Kleenex Pollen Radar, which you can easily add to your own dashboard.
This integration shows pollen information for grass, trees and weeds.
It’s available for the countries: The Netherlands, France, Italy, the United Kingdom and the United States of America.
Check the git repository to find out all options: https://github.com/MarcoGos/kleenex_pollenradar
Alternative integration
If your country isn’t in the list, or you want to try another data provider, you can also look at the Google Pollen integration.
Compatibility
This documentation is based on Home Assistant version 2025.3.4 and integration 1.1.7
In the past, due to updates in HA and the integration, the presentations were broken.
UPDATE 3 - 30 March 2025: All dashboard presentations YAML and screenshots are updated and now aligned again.
UPDATE 2 - 24 March 2025: Since Home Assistant version 2025.3.0 the colored background with the level indicator circle is broken. If you rollback to version 2025.2.2 it works as expected. If you see the screenshot the
<div class="icon-container" ..>is removed now. a href=”images_kleenex/ha_broken_update.png”></a>
UPDATE 1 - 23 March 2025: Since version 1.1.3 released at 17 March 2025 the data structure is changed for the integration. I updated this manual, and it’s now compatible with version 1.1.6
Table of Contents
Installation
Here are the steps to install this HACS Kleenex Pollen Radar integration.
-
Use this button to add the Kleenex pollen radar / Scottex integration:

- Click
Add integration
Now you get one search result. - Select the Kleenex integration
- Click on the detail page, in the right bottom corner on
Download
Now the integration is added, but not yet installed.
-
Click this button to install the integration:

-
Select your country and press the
Submitbutton.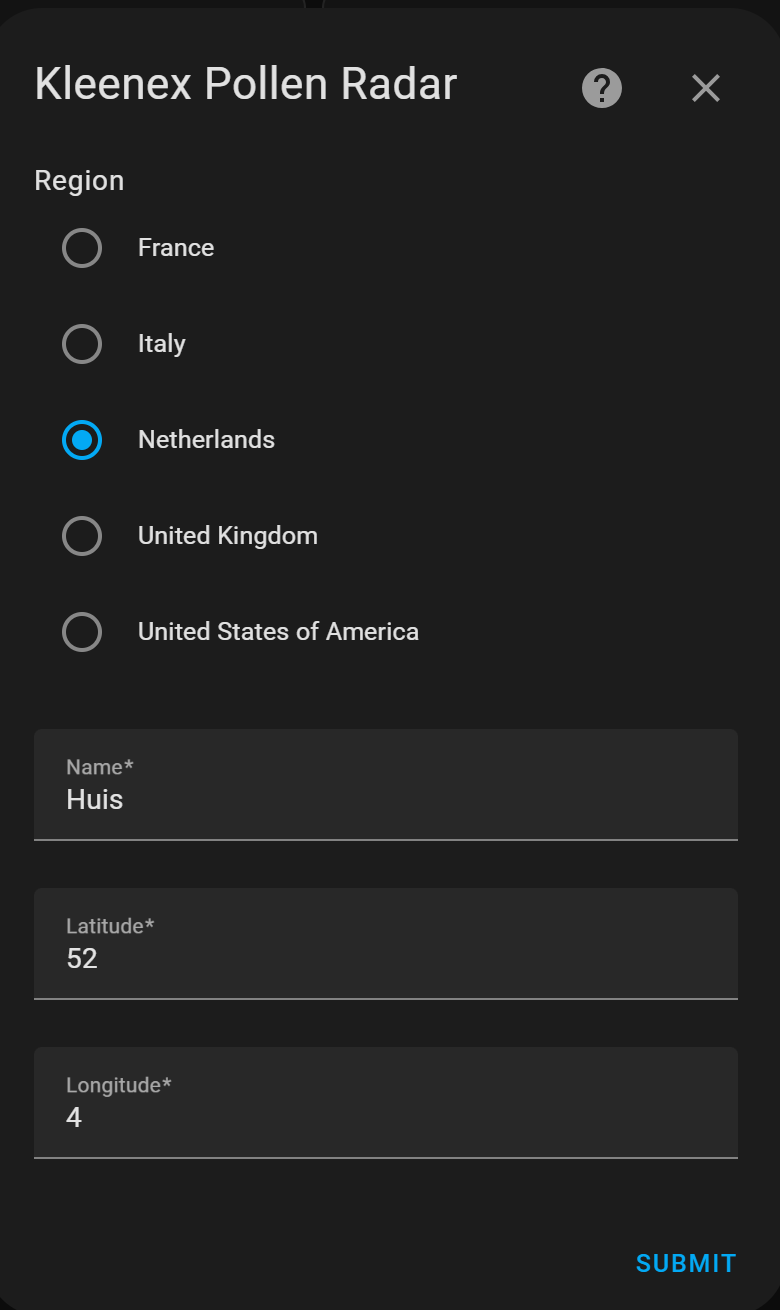
Now you have these five new sensors.
<img src=”images_kleenex/kleenex_sensors.png” alt=”Kleenex sensors” width=250px”>
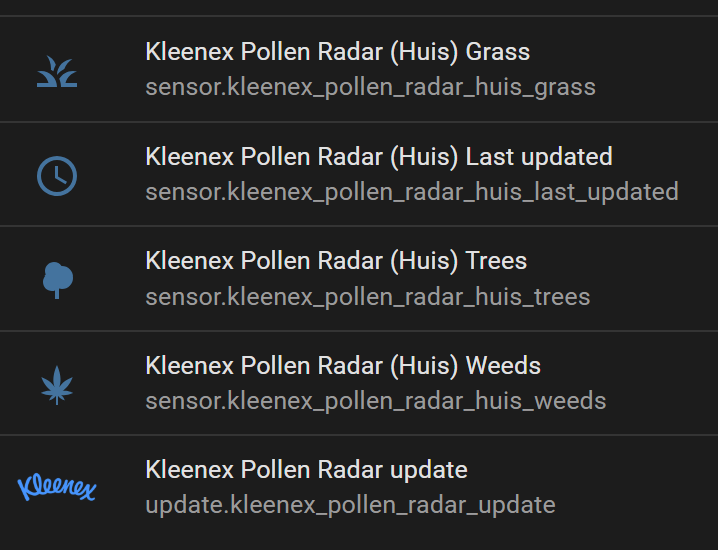
Subtypes in attributes
Each sensor also contains in its attribute value extra information about different subtypes and a forecast for the upcoming days.
These subtypes are possible:
- Trees
- Hazelaar (NL), Hazel (EN)
- Pijnboom (NL), Pine (EN)
- Populier (NL), Poplar (EN)
- Plataan (NL), Plane (EN)
- Cipres (NL), Cypress (EN)
- Els (NL), Els (EN)
- Iep (NL), Elm (EN)
- Berk (NL), Birch (EN)
- Eik (NL), Oak (EN)
- Grass
- Poaceae (NL), Poaceae (EN)
- Weeds
- Bijvoet (NL), Mugwort (EN)
- Ganzevoet (NL), Goosefoot (EN)
- Ambrosia (NL), Ambrosia (EN)
- Brandnetel (NL), Nettle (EN)
To see this subtype and forecast data, use this button to go to the Developer tools and filter the entities with the keyword kleenex.

Click on the image to see all the forecast and subtype details which are stored in the attribute data.
<img src=”images_kleenex/kleenex_forecast.png” alt=”Kleenex forecast” width=250px”>
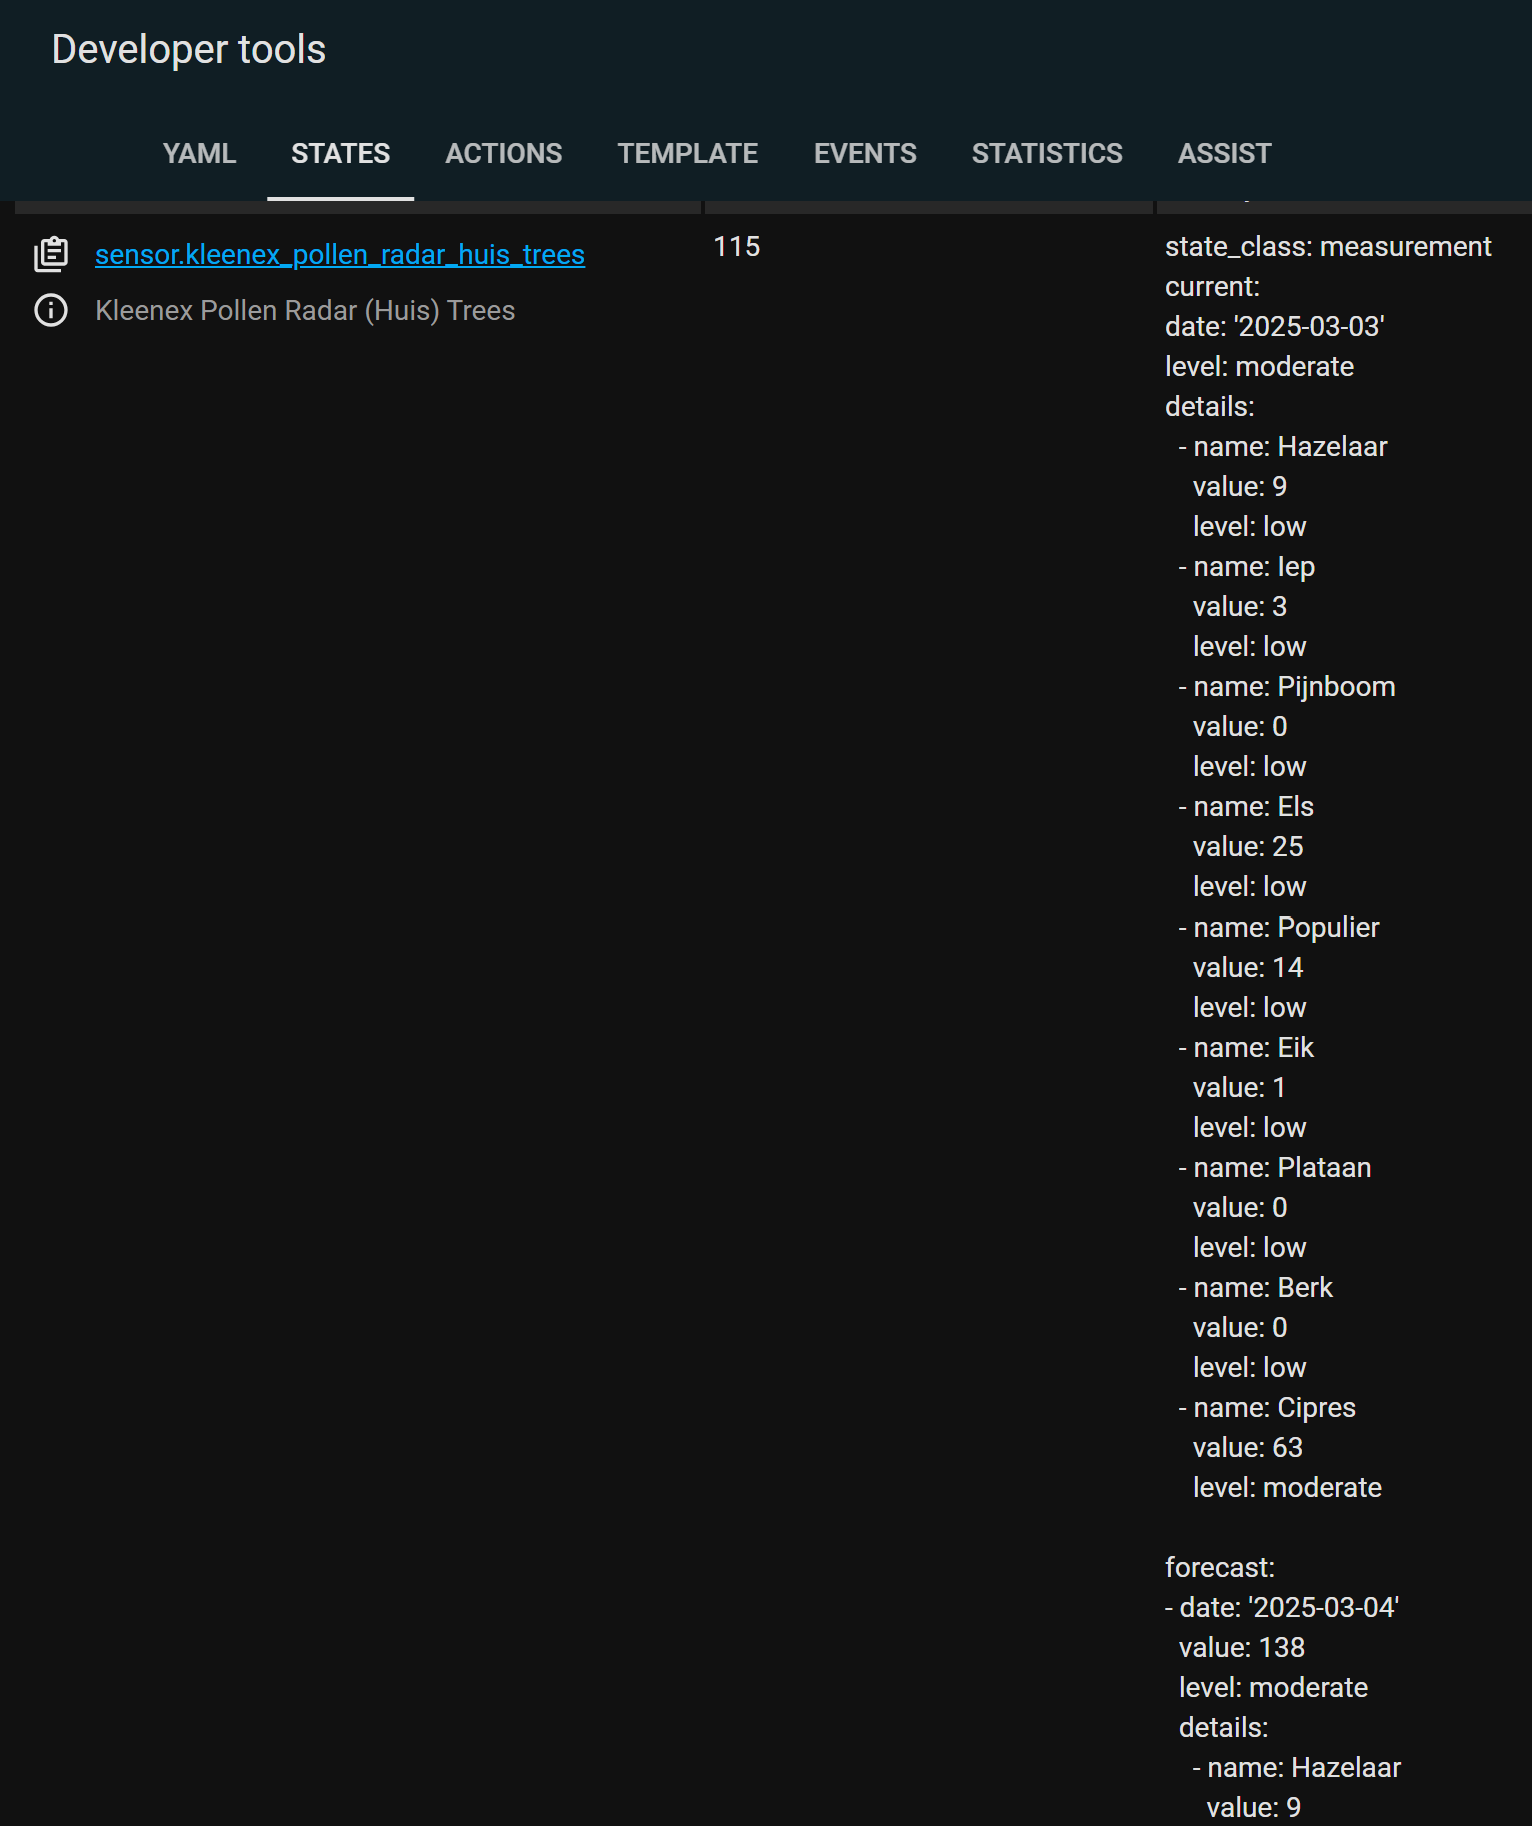
Dashboard presentations
I have different examples of how to present this data on your dashboard:
- Default as list entities - no extra modules needed.
- Mushroom template with bigger icons - extra mushroom modules required.
- Tile card with level indicator - extra helpers needed to create. With default Dutch text.
- Sub types - two tree subtype examples.
- Sub types forecast graph - trees forecast.
Alternative icons
If you want an alternative icon for weeds you can also use mdi:sprout or mdi:flower-pollen.
![]()
![]()
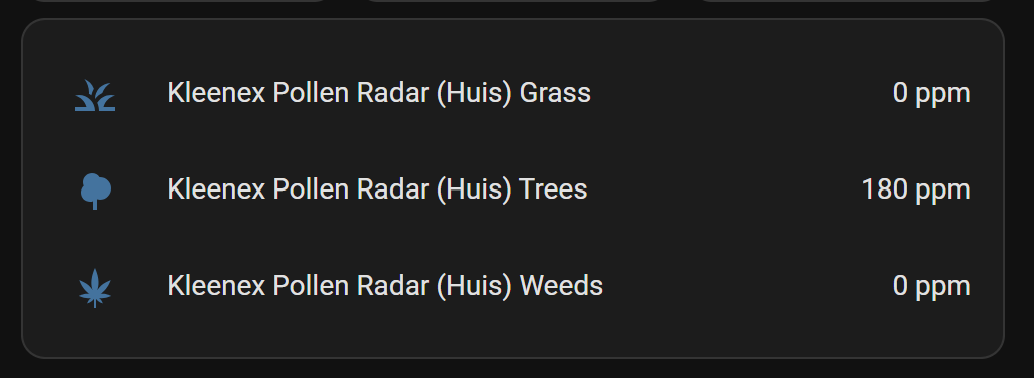
Default presentation
When the installation is complete, you get at least three entities which you can add to your dashboard.
This is a default presentation with the entities card.
# Sourcecode by vdbrink.github.io
# Entities Card Configuration
    type: entities
    entities:
      - sensor.kleenex_pollen_radar_huis_grass
      - sensor.kleenex_pollen_radar_huis_trees
      - sensor.kleenex_pollen_radar_huis_weeds
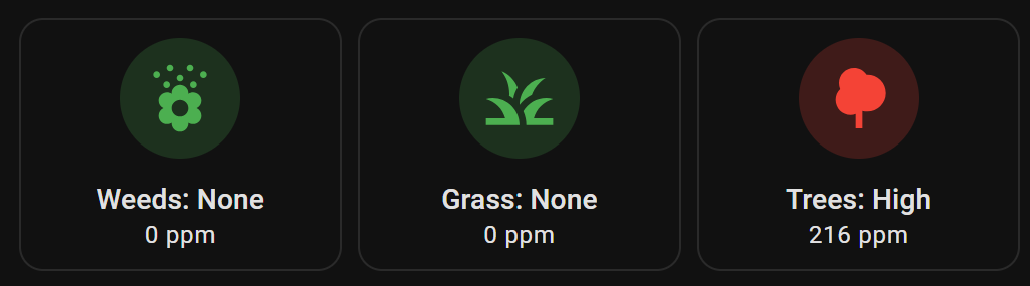
Mushroom
This presentation uses English levels and has bigger icons.
No need to create extra helper sensors.

This presentation required the HACS integration lovelace-mushroom to create this custom presentation.
Install the integration via this button:
> Click here to see the corresponding dashboard YAML code >>
# Sourcecode by vdbrink.github.io
type: grid
cards:
  - type: custom:mushroom-template-card
    primary: |-
      Weeds:
      {% set input_name = 'Ragweed' %}
      {% set details = state_attr('sensor.kleenex_pollen_radar_huis_weeds', 'details') %}
      {% set item = details | selectattr('name', 'eq', input_name) | first() %}
      {% set level = item.level | default('N/A') %}
      {% set color_map = {'none': 'green', 'low': 'green', 'moderate': 'orange', 'high': 'red','very high': 'maroon'} %} {{ level }}
    secondary: "{{ states('sensor.kleenex_pollen_radar_huis_weeds') }} ppm"
    icon: mdi:flower-pollen
    icon_color: |-
      {% set input_name = 'Ragweed' %}
      {% set details = state_attr('sensor.kleenex_pollen_radar_huis_weeds', 'details') %}
      {% set item = details | selectattr('name', 'eq', input_name) | first() %}
      {% set level = item.level | default('N/A') %}
      {% set color_map = {'none': 'green', 'low': 'green', 'moderate': 'orange', 'high': 'red', 'very high': 'maroon'} %}
      {% set level_color = color_map.get(level, 'gray') %} {{ level_color }}
    layout: vertical
    entity: sensor.kleenex_pollen_radar_huis_weeds
    multiline_secondary: false
    tap_action:
      action: more-info
    layout_options:
      grid_columns: 1
      grid_rows: 2
    card_mod:
      style: |
        ha-card {
          --icon-size: 60px;
          background-color: hsla(0, 0%, 0%, 0);
        }
  - type: custom:mushroom-template-card
    primary: >-
      Grass: {% set level =
      states('sensor.kleenex_pollen_radar_huis_grass')|int(0) %} {% if level ==
      0 %} None {% elif level <= 29 %} Low {% elif level <= 60 %} Moderate  {%
      elif level <= 341 %} High {% else %} very High {% endif %}
    secondary: "{{ states('sensor.kleenex_pollen_radar_huis_grass') }} ppm"
    icon: mdi:grass
    icon_color: |-
      {% set level =
      states('sensor.kleenex_pollen_radar_huis_grass')|int(0) %} {% if level ==
      0 %} green {% elif level <= 95 %} yellow {% elif level <= 207 %} orange  {%
      elif level <= 703 %} red {% else %} maroon {% endif %}
    layout: vertical
    entity: sensor.kleenex_pollen_radar_huis_grass
    multiline_secondary: false
    tap_action:
      action: more-info
    layout_options:
      grid_columns: 1
      grid_rows: 2
    card_mod:
      style: |
        ha-card {
          --icon-size: 60px;
          background-color: hsla(0, 0%, 0%, 0);
        }
  - type: custom:mushroom-template-card
    primary: >-
      Trees: {% set level =
      states('sensor.kleenex_pollen_radar_huis_trees')|int(0) %} {% if level ==
      0 %} None {% elif level <= 95 %} Low {% elif level <= 207 %} Moderate  {%
      elif level <= 703 %} High {% else %} very High {% endif %}
    secondary: "{{ states('sensor.kleenex_pollen_radar_huis_trees') }} ppm"
    icon: mdi:tree
    icon_color: |-
      {% set level =
       states('sensor.kleenex_pollen_radar_huis_trees')|int(0) %} {% if level ==
       0 %} green {% elif level <= 95 %} yellow {% elif level <= 207 %} orange  {%
       elif level <= 703 %} red {% else %} maroon {% endif %}
    layout: vertical
    entity: sensor.kleenex_pollen_radar_huis_trees
    multiline_secondary: false
    tap_action:
      action: more-info
    layout_options:
      grid_columns: 1
      grid_rows: 2
    card_mod:
      style: |
        ha-card {
          --icon-size: 60px;
          background-color: hsla(0, 0%, 0%, 0);
        }
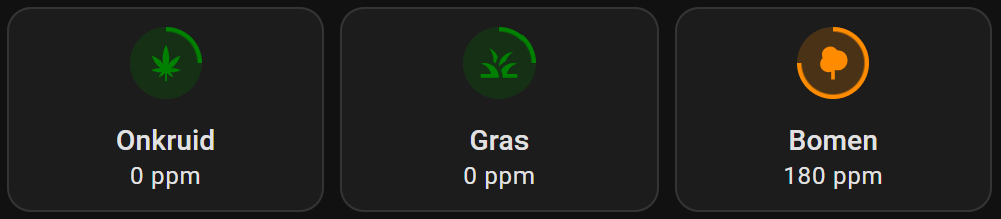
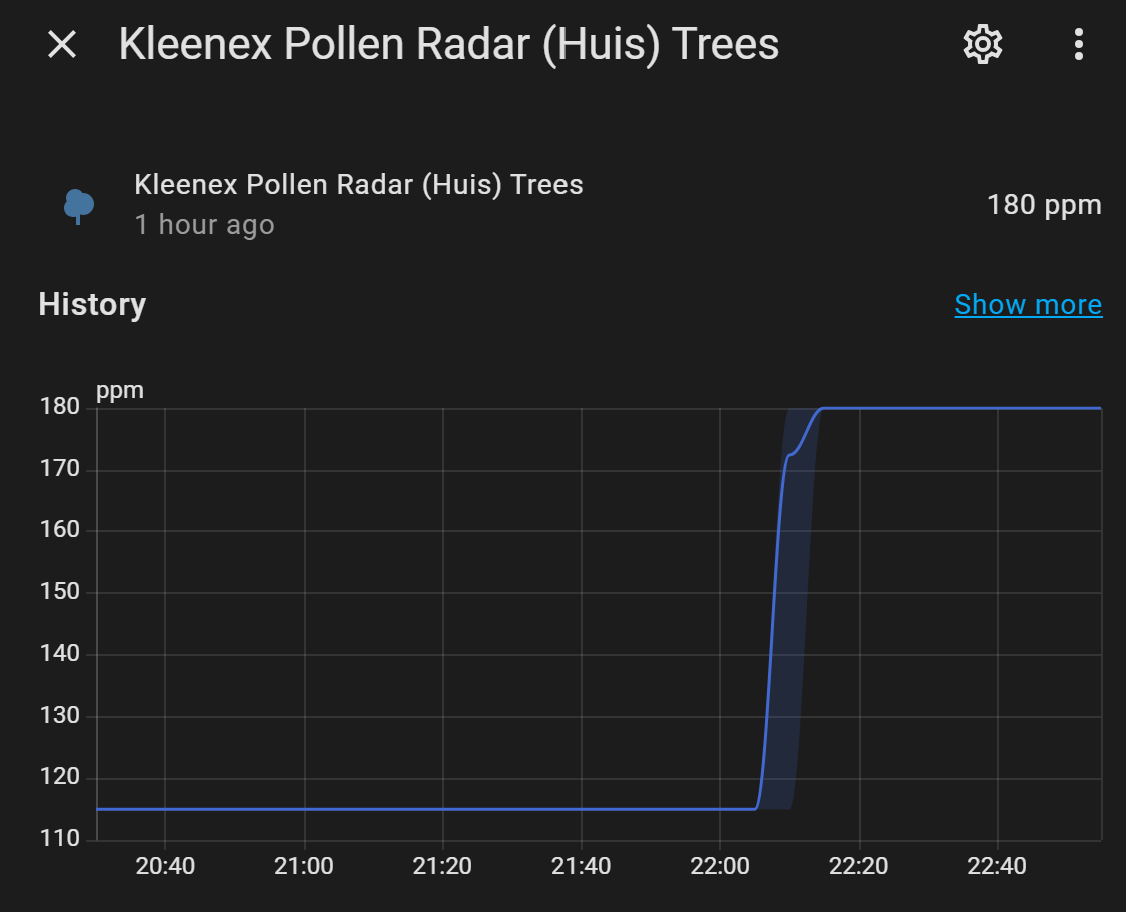
Tile card with progress indicator
This presentation shows the entities with matching colors and a level border color.
The entities are clickable which show you the values over time:
This presentation required the HACS module lovelace-card-mod to add custom CSS styling like the progress circle.
Install this integration, via this button, into your own Home Assistant instance:
Dashboard code
> Click here to see the corresponding dashboard YAML code >>
# Sourcecode by vdbrink.github.io
# Horizontal Stack Card Configuration
type: horizontal-stack
cards:
  - entity: sensor.kleenex_pollen_radar_huis_weeds
    name: Onkruid
    type: tile
    vertical: true
    tap_action:
      action: more-info
    card_mod:
      style: |
        ha-tile-icon {
          {% set level = states('sensor.kleenex_pollen_radar_huis_weeds_level') %}
          {% set color = {'low':'green','moderate':'orange','high':'red','very-high':'maroon'} %}
          {% set level_color = color.get(level,'gray') %}
          {% set circle = {'low':'25','moderate':'50','high':'75','very-high':'100'} %}
          {% set percentage = circle.get(level,'25') %}
          border-radius: 24px;
          background: radial-gradient(var(--card-background-color) 60%,transparent calc(60% + 1px)),
          conic-gradient({{level_color}} {{percentage}}% 0%,
          var(--card-background-color) 0% 100%);
          --tile-color: {{level_color}};
        }
  - entity: sensor.kleenex_pollen_radar_huis_grass
    name: Gras
    type: tile
    vertical: true
    tap_action:
      action: more-info
    card_mod:
      style: |
        ha-tile-icon {
          {% set level = states('sensor.kleenex_pollen_radar_huis_grass_level') %}
          {% set color = {'low':'green','moderate':'orange','high':'red','very-high':'maroon'} %}
          {% set level_color = color.get(level,'gray') %}
          {% set circle = {'low':'25','moderate':'50','high':'75','very-high':'100'} %}
          {% set percentage = circle.get(level,'25') %}
          border-radius: 24px;
          background: radial-gradient(var(--card-background-color) 60%,transparent calc(60% + 1px)),
          conic-gradient({{level_color}} {{percentage}}% 0%,
          var(--card-background-color) 0% 100%);
          --tile-color: {{level_color}};
        }
  - entity: sensor.kleenex_pollen_radar_huis_trees
    name: Bomen
    type: tile
    vertical: true
    tap_action:
      action: more-info
    card_mod:
      style: |
        ha-tile-icon {
          {% set level = states('sensor.kleenex_pollen_radar_huis_trees_level') %}
          {% set color = {'low':'green','moderate':'orange','high':'red','very-high':'maroon'} %}
          {% set level_color = color.get(level,'gray') %}
          {% set circle = {'low':'25','moderate':'50','high':'75','very-high':'100'} %}
          {% set percentage = circle.get(level,'25') %}
          border-radius: 24px;
          background: radial-gradient(var(--card-background-color) 60%,transparent calc(60% + 1px)),
          conic-gradient({{level_color}} {{percentage}}% 0%,
          var(--card-background-color) 0% 100%);
          --tile-color: {{level_color}};
        }
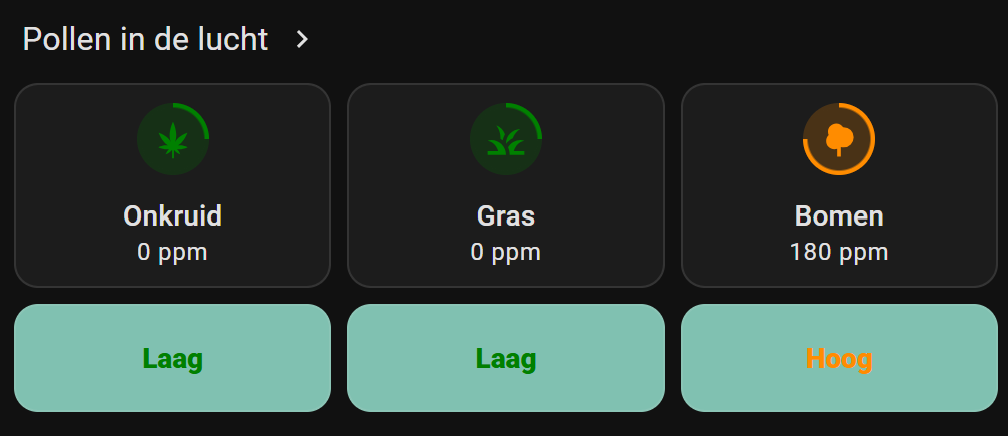
Tile card: with an extra clickable link and labels
Show a clickable link to the Kleenex website, the entities with matching colors and colored labels, like this:
> Click here to see the corresponding dashboard YAML code >>
# Sourcecode by vdbrink.github.io
# Entities Card Configuration
type: vertical-stack
cards:
  - type: heading
    heading: Pollen in de lucht
    heading_style: title
    card_mod:
      class: class-section-heading
    tap_action:
      action: url
      url_path: https://www.kleenex.nl/pollenradar
  - type: horizontal-stack
    cards:
      - entity: sensor.kleenex_pollen_radar_huis_weeds
        name: Onkruid
        type: tile
        vertical: true
        tap_action:
          action: more-info
        card_mod:
          style: |
            ha-tile-icon {
              {% set level = states('sensor.kleenex_pollen_radar_huis_weeds_level') %}
              {% set color = {'low':'green','moderate':'orange','high':'red','very-high':'maroon'} %}
              {% set level_color = color.get(level,'gray') %}
              {% set circle = {'low':'25','moderate':'50','high':'75','very-high':'100'} %}
              {% set percentage = circle.get(level,'25') %}
              border-radius: 24px;
              background: radial-gradient(var(--card-background-color) 60%,transparent calc(60% + 1px)),
              conic-gradient({{level_color}} {{percentage}}% 0%,
              var(--card-background-color) 0% 100%);
              --tile-color: {{level_color}};
            }
      - entity: sensor.kleenex_pollen_radar_huis_grass
        name: Gras
        type: tile
        vertical: true
        tap_action:
          action: more-info
        card_mod:
          style: |
            ha-tile-icon {
              {% set level = states('sensor.kleenex_pollen_radar_huis_grass_level') %}
              {% set color = {'low':'green','moderate':'orange','high':'red','very-high':'maroon'} %}
              {% set level_color = color.get(level,'gray') %}
              {% set circle = {'low':'25','moderate':'50','high':'75','very-high':'100'} %}
              {% set percentage = circle.get(level,'25') %}
              border-radius: 24px;
              background: radial-gradient(var(--card-background-color) 60%,transparent calc(60% + 1px)),
              conic-gradient({{level_color}} {{percentage}}% 0%,
              var(--card-background-color) 0% 100%);
              --tile-color: {{level_color}};
            }
      - entity: sensor.kleenex_pollen_radar_huis_trees
        name: Bomen
        type: tile
        vertical: true
        tap_action:
          action: more-info
        card_mod:
          style: |
            ha-tile-icon {
              {% set level = states('sensor.kleenex_pollen_radar_huis_trees_level') %}
              {% set color = {'low':'green','moderate':'orange','high':'red','very-high':'maroon'} %}
              {% set level_color = color.get(level,'gray') %}
              {% set circle = {'low':'25','moderate':'50','high':'75','very-high':'100'} %}
              {% set percentage = circle.get(level,'25') %}
              border-radius: 24px;
              background: radial-gradient(var(--card-background-color) 60%,transparent calc(60% + 1px)),
              conic-gradient({{level_color}} {{percentage}}% 0%,
              var(--card-background-color) 0% 100%);
              --tile-color: {{level_color}};
            }
  - type: horizontal-stack
    cards:
      - type: markdown
        entity: sensor.kleenex_pollen_radar_huis_weeds_level
        card_mod:
          style: |
            ha-card {
              background: rgb(128,193,177);
              color:
                 {% set level = states('sensor.kleenex_pollen_radar_huis_weeds_level') %}
                 {% set color = {'low':'green','moderate':'orange','high':'red','very-high':'maroon'} %}
                 {% set level_color = color.get(level,'gray') %}
                {{level_color}};
              font-weight: 800;
              text-align: center;
            }
        content: |
          {% set level = states(config.entity) %}
          {% set text = {'low':'low','moderate':'moderate','high':'high','very-high':'very high'} %}
          {% set level_text = text.get(level,'onbekend') %}
          {{ level_text }}
      - type: markdown
        entity: sensor.kleenex_pollen_radar_huis_grass_level
        card_mod:
          style: |
            ha-card {
              background: rgb(128,193,177);
              color:
                {% set level = states('sensor.kleenex_pollen_radar_huis_grass_level') %}
                {% set color = {'low':'green','moderate':'orange','high':'red','very-high':'maroon'} %}
                {% set level_color = color.get(level,'gray') %}
                {{level_color}};
              font-weight: 800;
              text-align: center;
            }
        content: |
          {% set level = states(config.entity) %}
          {% set text = {'low':'laag','moderate':'gemiddeld','high':'hoog','very-high':'heel hoog'} %}
          {% set level_text = text.get(level,'onbekend') %}
          {{ level_text }}
      - type: markdown
        entity: sensor.kleenex_pollen_radar_huis_trees_level
        card_mod:
          style: |
            ha-card {
              background: rgb(128,193,177);
              color:
                {% set level = states('sensor.kleenex_pollen_radar_huis_trees_level') %}
                {% set color = {'low':'green','moderate':'orange','high':'red','very-high':'maroon'} %}
                {% set level_color = color.get(level,'gray') %}
                {{level_color}};
              font-weight: 800;
              text-align: center;
            }
        content: |
          {% set level = states(config.entity) %}
          {% set text = {'low':'laag','moderate':'gemiddeld','high':'hoog','very-high':'heel hoog'} %}
          {% set level_text = text.get(level,'onbekend') %}
          {{ level_text }}
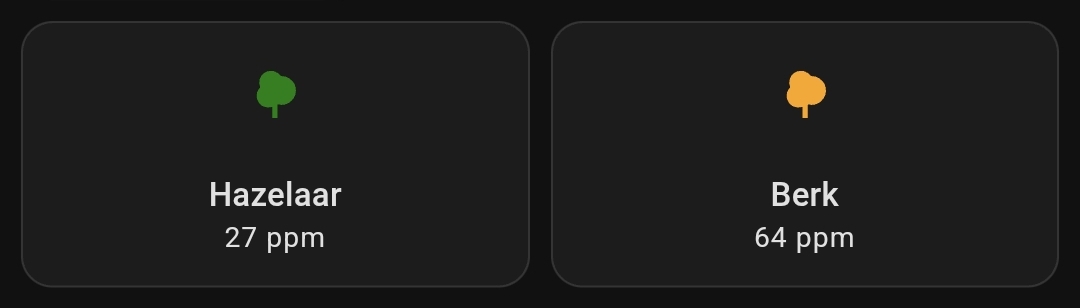
Subtypes values
I filtered from the tree attributes the values from the Hazelaar (Hazel) and Berk (Birch).
> Click here to see the corresponding dashboard YAML code >>
# Sourcecode by vdbrink.github.io
# Entities Card Configuration
type: horizontal-stack
cards:
  - type: tile
    entity: sensor.kleenex_pollen_radar_huis_trees
    name: Hazelaar
    grid_options:
      columns: 3
      rows: 2
    vertical: true
    card_mod:
      style:
        ha-tile-icon: >
          {% set input_name = 'Hazelaar' %}
          {% set details = state_attr('sensor.kleenex_pollen_radar_huis_trees', 'details') %}
          {% set item = details | selectattr('name', 'eq', input_name) | first() %}
          {% set level = item.level | default('N/A') %}
          {% set color_map = {'low': 'green', 'moderate': 'orange', 'high': 'red', 'very high': 'maroon'} %}
          {% set level_color = color_map.get(level, 'gray') %}

          ha-state-icon {
            conic-gradient({{ level_color }} var(--card-background-color) 0% 100%);
          }

          ha-tile-icon {
             --tile-color: {{level_color}};
          }
        ha-tile-info$: >
          {% set input_name = 'Hazelaar' %}
          {% set details = state_attr('sensor.kleenex_pollen_radar_huis_trees', 'details') %}
          {% set item = details | selectattr('name', 'eq', input_name) | first() %}

          .secondary state-display {
            display: none;
          }

          .secondary::after {
            content: "{{ item.value }} ppm";
            display: block;
            text-align: center;
          }
  - type: tile
    entity: sensor.kleenex_pollen_radar_huis_trees
    name: Berk
    grid_options:
      columns: 3
      rows: 2
    vertical: true
    card_mod:
      style:
        ha-tile-icon: >
          {% set input_name = 'Berk' %}
          {% set details = state_attr('sensor.kleenex_pollen_radar_huis_trees', 'details') %}
          {% set item = details | selectattr('name', 'eq', input_name) | first() %}
          {% set level = item.level | default('N/A') %}
          {% set color_map = {'low': 'green', 'moderate': 'orange', 'high': 'red', 'very high': 'maroon'} %}
          {% set level_color = color_map.get(level, 'gray') %}

          ha-state-icon {
            conic-gradient({{ level_color }} var(--card-background-color) 0% 100%);
          }

          ha-tile-icon {
             --tile-color: {{level_color}};
          }
        ha-tile-info$: >
          {% set input_name = 'Berk' %}
          {% set details = state_attr('sensor.kleenex_pollen_radar_huis_trees', 'details') %}
          {% set item = details | selectattr('name', 'eq', input_name) | first() %}

          .secondary state-display {
            display: none;
          }

          .secondary::after {
            content: "{{ item.value }} ppm";
            display: block;
            text-align: center;
          }
Specific subtypes forecast
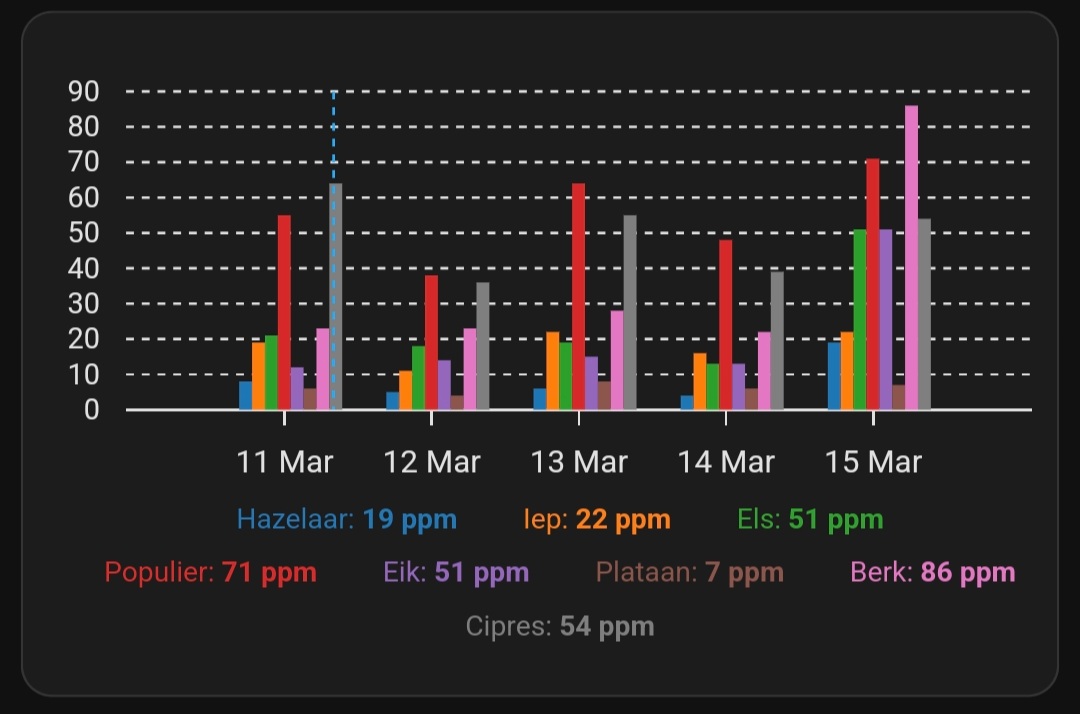
ApexCharts
I created a bar graph with all tree data for the upcoming days. I used for this presentation the HACS ApexCharts Card integration.
Click this button to install the ApexCharts Card:
> Click here to see the corresponding dashboard YAML code >>
# Sourcecode by vdbrink.github.io
# Entities Card Configuration
type: custom:apexcharts-card
now:
  show: true
graph_span: 3d
span:
  start: day
  offset: +2d
all_series_config:
  show:
    legend_value: false
series:
  - name: Hazelaar
    entity: sensor.kleenex_pollen_radar_huis_trees
    type: column
    color: "#1f77b4"
    data_generator: >
      return entity.attributes.forecast.map(d => [new
      Date(d.date).getTime(), d.details.find(t => t.name === "Hazelaar").value]);
  - name: Iep
    entity: sensor.kleenex_pollen_radar_huis_trees
    type: column
    color: "#ff7f0e"
    data_generator: >
      return entity.attributes.forecast.map(d => [new
      Date(d.date).getTime(), d.details.find(t => t.name === "Iep").value]);
  - name: Els
    entity: sensor.kleenex_pollen_radar_huis_trees
    type: column
    color: "#2ca02c"
    data_generator: >
      return entity.attributes.forecast.map(d => [new
      Date(d.date).getTime(), d.details.find(t => t.name === "Els").value]);
  - name: Populier
    entity: sensor.kleenex_pollen_radar_huis_trees
    type: column
    color: "#d62728"
    data_generator: >
      return entity.attributes.forecast.map(d => [new
      Date(d.date).getTime(), d.details.find(t => t.name === "Populier").value]);
  - name: Eik
    entity: sensor.kleenex_pollen_radar_huis_trees
    type: column
    color: "#9467bd"
    data_generator: >
      return entity.attributes.forecast.map(d => [new
      Date(d.date).getTime(), d.details.find(t => t.name === "Eik").value]);
  - name: Plataan
    entity: sensor.kleenex_pollen_radar_huis_trees
    type: column
    color: "#8c564b"
    data_generator: >
      return entity.attributes.forecast.map(d => [new
      Date(d.date).getTime(), d.details.find(t => t.name === "Plataan").value]);
  - name: Berk
    entity: sensor.kleenex_pollen_radar_huis_trees
    type: column
    color: "#e377c2"
    data_generator: >
      return entity.attributes.forecast.map(d => [new
      Date(d.date).getTime(), d.details.find(t => t.name === "Berk").value]);
  - name: Cipres
    entity: sensor.kleenex_pollen_radar_huis_trees
    type: column
    color: "#7f7f7f"
    data_generator: >
      return entity.attributes.forecast.map(d => [new
      Date(d.date).getTime(), d.details.find(t => t.name === "Cipres").value]);
apex_config:
  chart:
    type: bar
  xaxis:
    type: datetime
  plotOptions:
    bar:
      columnWidth: 70%
  tooltip:
    enabled: true
  legend:
    labels:
      useSeriesColors: true
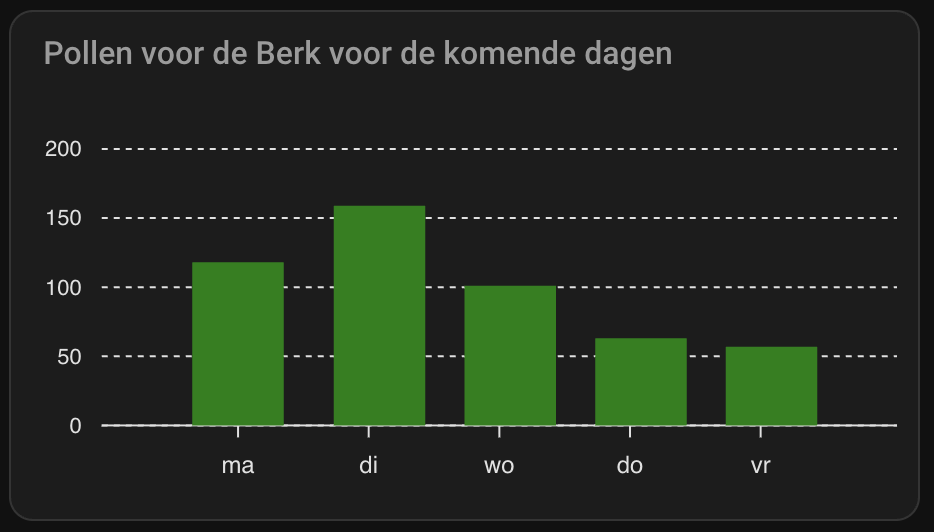
ApexCharts 2: Berk tree forecast
I created a bar graph with only the Berk tree data for today and the upcoming days. This is the tree that causes the most irritations for me. That’s why I use this specific one. You can easily change it to another available tree, grass or weed which you prefer.
The days are converted to shorten weekdays in Dutch as example.
I used for this presentation the HACS ApexCharts Card integration. Click this button to install the ApexCharts Card:
> Click here to see the corresponding dashboard YAML code >>
# Sourcecode by vdbrink.github.io
# Card Configuration
type: custom:apexcharts-card
header:
  show: true
  title: Pollen voor de Berk voor de komende dagen
graph_span: 4d
span:
  start: day
series:
  - name: Berk
    entity: sensor.kleenex_pollen_radar_huis_trees
    type: column
    color: green
    data_generator: >
      const today = new Date(); today.setHours(0, 0, 0, 0); const todayValue =
      entity.attributes.details
        ? entity.attributes.details.find(t => t.name === "Berk")?.value ?? null
        : null;
      const todayPoint = todayValue !== null ? [[today.getTime(), todayValue]] :
      []; const forecastPoints = entity.attributes.forecast.map(d => [
        new Date(d.date).getTime(),
        d.details.find(t => t.name === "Berk").value
      ]); return [...todayPoint, ...forecastPoints];
apex_config:
  chart:
    type: bar
    defaultLocale: nl
    locales:
      - name: nl
        options:
          shortDays:
            - zo
            - ma
            - di
            - wo
            - do
            - vr
            - za
    height: 200
  xaxis:
    type: datetime
    labels:
      datetimeFormatter:
        day: ddd
  tooltip:
    enabled: true
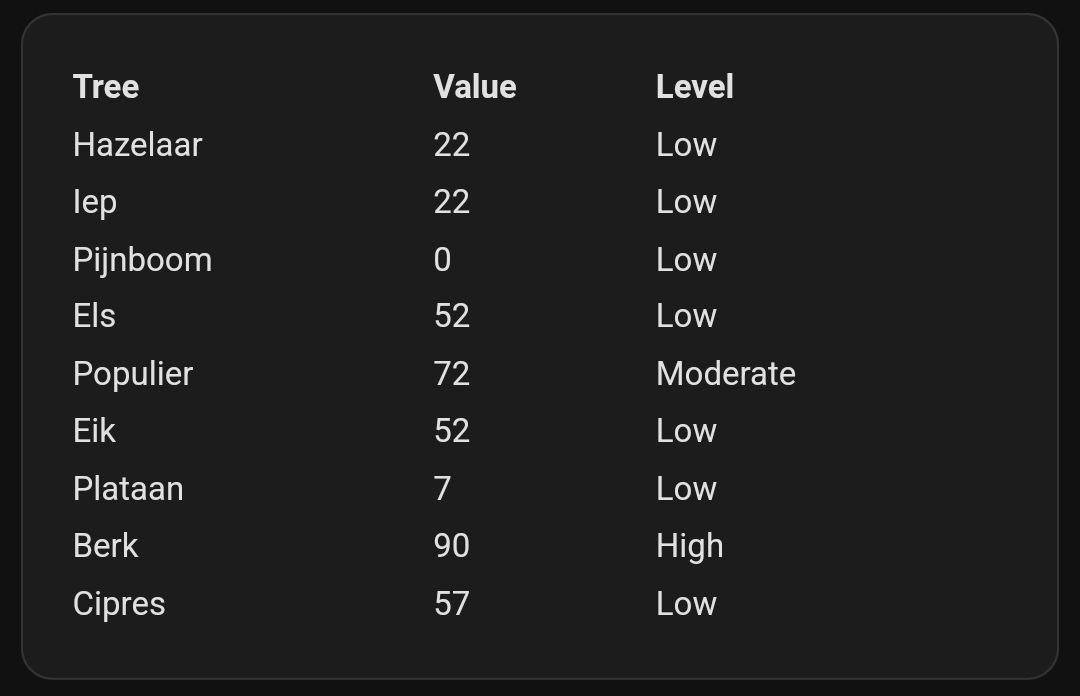
Markdown table
I created a table, based on a Markdown Card, with all tree data for today.
> Click here to see the corresponding dashboard YAML code >>
# Sourcecode by vdbrink.github.io
# Markdown Card Configuration
type: markdown
content: >-
  <table width="100%">
    <thead>
      <tr>
        <th align="left">Tree</th>
        <th align="left">Value</th>
        <th align="left">Level</th>
      </tr>
    </thead>
    <tbody>
  {% set pollen =
  state_attr('sensor.kleenex_pollen_radar_huis_trees','details') %}{%
  for tree in pollen %}
    <tr>
      <td>{{ tree.name }}</td>
      <td>{{ tree.value }}</td>
      <td>{{ tree.level }}</td>
    </tr>
  {% endfor %}
    </tbody>
  </table>
card_mod:
  style: |
    ha-card {
      font-size: 14px;
      th {
        text-align:left;
      }
    }
Good luck with the integration!
Any questions or suggestions?
Please let me know so I can improve this page for the next reader.
Credits
I got some ideas for the presentations from this HA forum:
[Help request] Pollen sensor Dutch hooikoortsradar.nl
If you got any questions you can also ask them here.
« See also my other Home Assistant tips and tricks
Home Assistant integration: Afvalbeheer »
See also my Smart home Best Buy Tips:
^^ Top | Homepage | Best Buy Tips | Automation Ideas | Blog posts