Home Assistant dashboard: Layout
![]()
Here you will find Home Assistant dashboard layout tips.
I like compact layouts.
Over the years I found different ways to group a lot of entity state information together in a compact and readable way.
I only show entities that are relevant for the time of day, the season, or whatever else matters at that moment.
I hope you can use these examples for your own dashboard.
NOTE: Some of the examples require an extra HACS integration. If possible, I added a link which makes it possible to directly install it on your own Home Assistant instance.
Table of Contents
- Horizontal stack
- Vertical stack
- Data in a row
- Grid
- Six in a row
- With a slider
- Only the sensor state
- Conditional visible
- Entities sorted by state
- Card per room
- Embed Grafana graph
Horizontal stack
With a horizontal-stack, you can place multiple entities next to each other in one row.
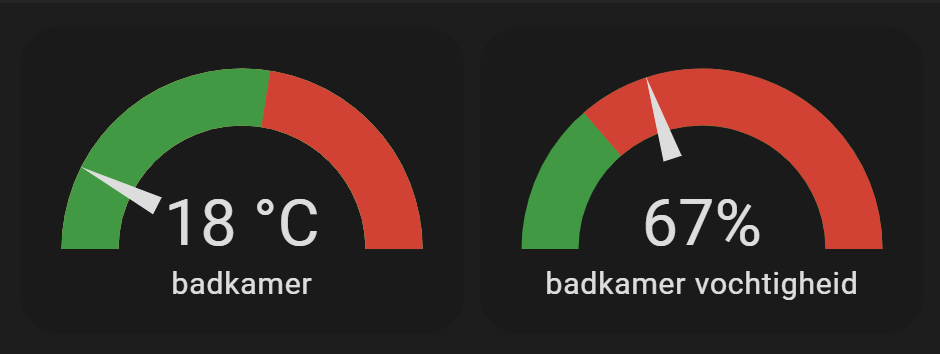
Here you see two gauges next to each other instead of the usual double-sized cards stacked below one another.
# Sourcecode by vdbrink.github.io
type: horizontal-stack
cards:
  - type: gauge
    entity: sensor.temp1_temperature_rounded
    theme: ios-dark-mode
    needle: true
    min: 15
    max: 35
    severity:
      green: 10
      yellow: 0
      red: 26
  - type: gauge
    entity: sensor.temp1_humidity_rounded
    theme: ios-dark-mode
    needle: true
    severity:
      green: 45
      red: 60
    min: 45
    max: 100
Vertical stack
With a vertical-stack card, you can group cards underneath each other. Reordering the cards will not change their layout.
In this example, you see a button panel built with a vertical stack of 3 rows.
Each row has a horizontal stack. That keeps all buttons the same size and position.
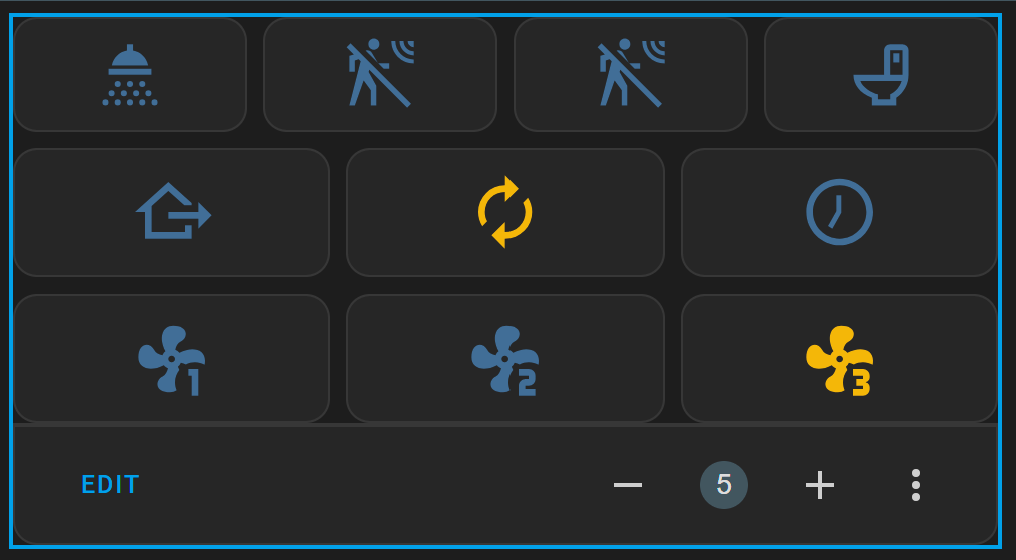
In this YAML, the button content is removed so it only shows the idea and structure of the code.
# Sourcecode by vdbrink.github.io
type: vertical-stack
cards:
  - type: horizontal-stack
    cards:
      - show_name: false
        show_icon: true
        type: button
        entity: binary_sensor.shower
      - type: button
        entity: binary_sensor.motion1
        show_name: false
      - type: button
        entity: binary_sensor.motion2
        show_name: false
      - type: button
        entity: binary_sensor.toilet
        show_name: false
  - type: horizontal-stack
    cards:
      - type: button
        ...
      - type: button
        ...
      - type: button
        ...
  - type: horizontal-stack
    cards:
      - type: button
        ...
      - type: button
        ...
      - type: button
        ...
Data in a row
Different types of (weather) data, with rounded states, can sit next to each other in a single row. This saves a lot of space compared to a normal entity list.
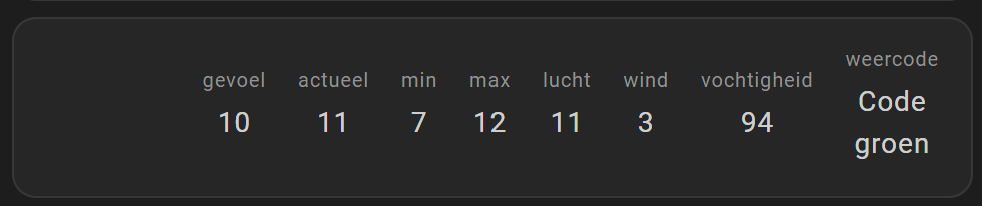
The custom HACS integration multiple-entity-row is used here.
Install this integration in your own Home Assistant instance via this button.

# Sourcecode by vdbrink.github.io
- type: entities
  entities:
    - entity: sensor.temperature_feels_like_rounded
      type: custom:multiple-entity-row
      name: ' '
      icon: mdi:blank
      show_state: false
      style: |
        .entity div {
          white-space: nowrap
        }
        .entities-row {
          margin-left: -50px
        }
        .image {
          width: 100%;
          height: 200px;
          background-size: cover;
          object-fit: cover;
        }
      entities:
        - entity: sensor.temperature_feels_like_rounded
          unit: false
        - entity: sensor.temperature_actual_rounded
          name: actueel
          unit: false
        - entity: sensor.temperature_min_rounded
          name: min
          unit: false
        - entity: sensor.temperature_max_rounded
          name: max
          unit: false
        - entity: sensor.temperature_airtemp_rounded
          name: lucht
          unit: false
        - entity: sensor.temperature_wind
          unit: false
        - entity: sensor.temperature_humidity_rounded
          unit: false
          name: vochtigheid
        - entity: sensor.knmi_weercode
          name: weercode
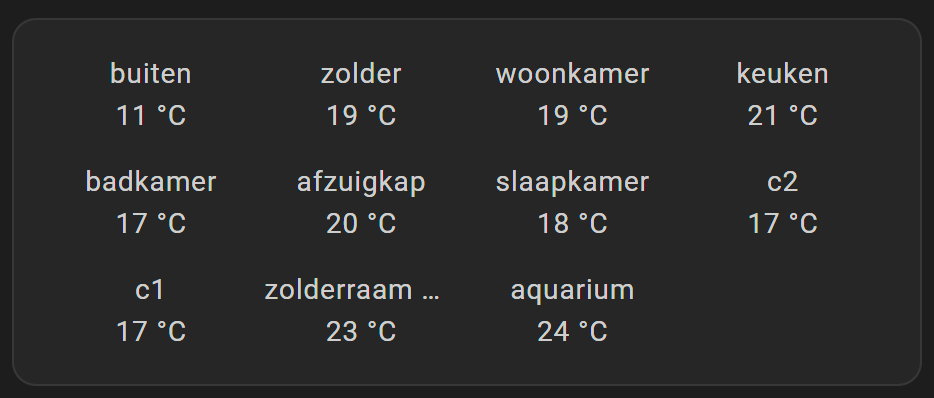
Grid
Present rounded temperatures in a 4 x 3 grid.
# Sourcecode by vdbrink.github.io
  - type: glance
    entities:
      - entity: sensor.temp1_temperature_rounded
      - entity: sensor.temp2_temperature_rounded
      - entity: sensor.temp3_temperature_rounded
      - entity: sensor.temp4_temperature_rounded
      - entity: sensor.temp5_temperature_rounded
      - entity: sensor.temp6_temperature_rounded
      - entity: sensor.temp7_temperature_rounded
      - entity: sensor.temp8_temperature_rounded
      - entity: sensor.temp9_temperature_rounded
      - entity: sensor.temp10_temperature_rounded
      - entity: sensor.temp11_temperature_rounded
    show_state: true
    columns: 4
    show_icon: false
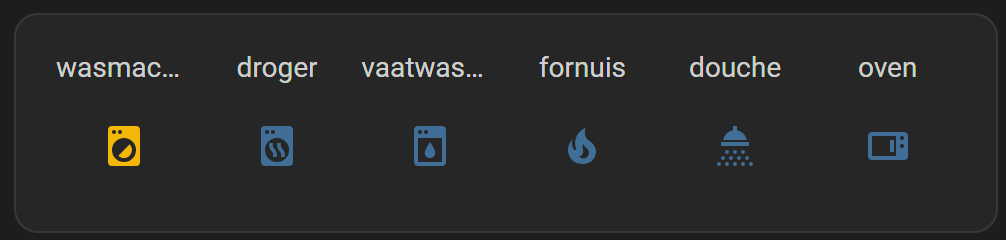
Six in a row
Show machine status next to each other.
The color indicates the state, so no text label is needed.
# Sourcecode by vdbrink.github.io
  - type: glance
    show_name: true
    show_icon: true
    show_state: false
    entities:
      - entity: binary_sensor.washingmachine
      - entity: binary_sensor.dryer
      - entity: binary_sensor.dishwasher
      - entity: binary_sensor.stove
      - entity: binary_sensor.shower
      - entity: binary_sensor.oven
    state_color: true
    columns: 6
With a slider
Show a light entity with a slider in a row or around the icon.
Use the slider to dim the light.
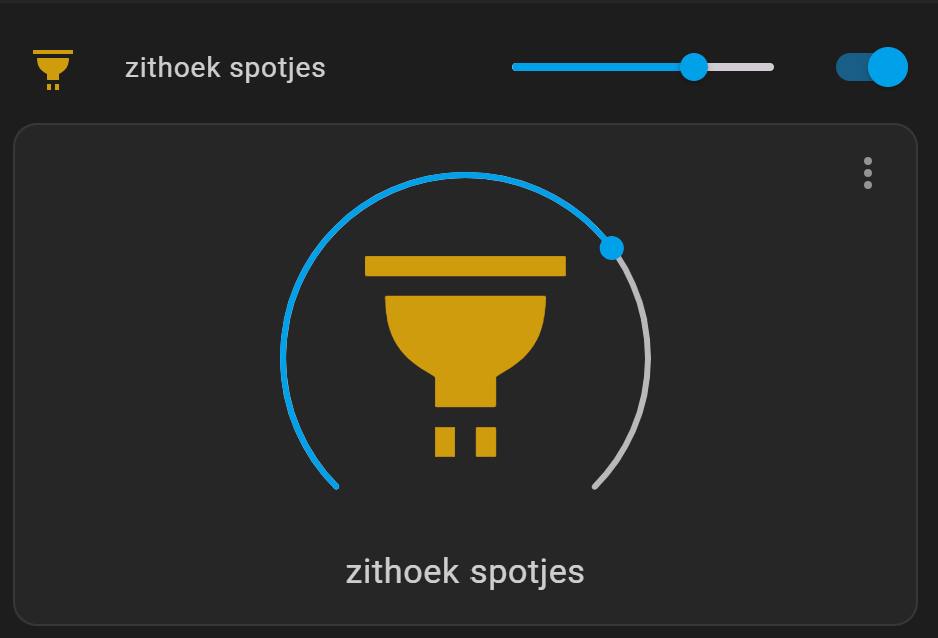
The custom HACS integration slider-entity-row is also used here.
Install this integration in your own Home Assistant instance via this button.
# Sourcecode by vdbrink.github.io
type: vertical-stack
cards:
  - type: custom:slider-entity-row
    entity: light.dimmer
    toggle: true
  - type: light
    entity: light.dimmer
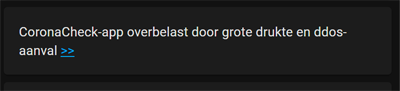
Only the sensor state
Show only the sensor state and use the full width of the card for the text. There is also a link for more information.
# Sourcecode by vdbrink.github.io
- type: markdown
  content: |
  {{ states('sensor.web_scrape') }} [>>](https://nu.nl)
See the webscraper page for how to add this text as a sensor.
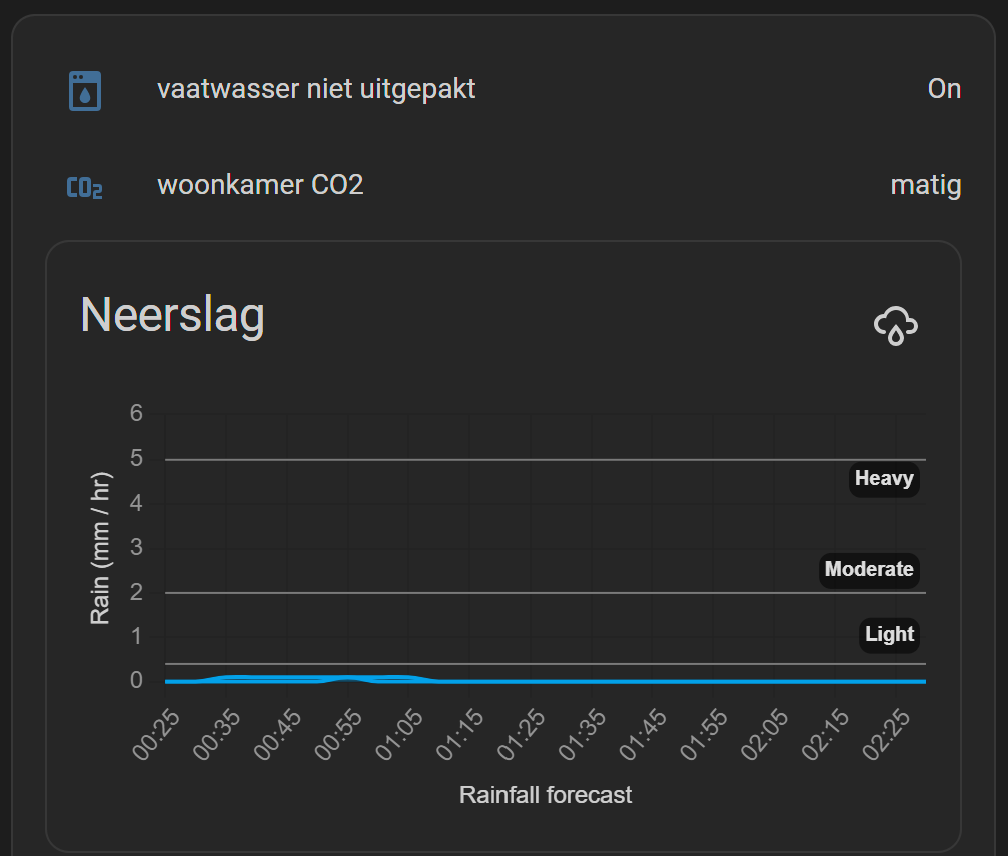
Conditional visible
Sometimes you only want to show an entity if it has a specific state.
For example, if no rain is expected, there is no reason to keep that graph visible on the dashboard. It only wastes space.
This approach makes your dashboard more dynamic and compact, and it keeps the focus on useful information.
# Sourcecode by vdbrink.github.io
- type: entities
  entities:

    # dishwasher still full, state is on
    - type: conditional
      conditions:
        - entity: binary_sensor.dishwasher_packed
          state: 'on'
      row:
        entity: binary_sensor.dishwasher_packed

      # weather alarm code is NOT green
      # show current code and this row is clickable
      - type: conditional
        conditions:
          - entity: sensor.knmi_weercode
            state_not: Code groen
        row:
          entity: sensor.knmi_weercode
          tap_action:
            action: url
            url_path: https://www.knmi.nl/nederland-nu/weer/waarschuwingen/zuid-holland

      # show the rain prediction graph only when rain is expected
      - type: conditional
        conditions:
          - entity: binary_sensor.rain_expected
            state: 'on'
        row:
          type: custom:neerslag-card
          title: Neerslag
          entities:
            - sensor.neerslag_buienalarm_regen_data
            - sensor.neerslag_buienradar_regen_data
The weather alarm entity used here is based on the KNMI weather alarm scraper.
NOTE: The
rain_expectedsensor here is a personal custom sensor, provided by a Node-RED script that checkssensor.neerslag_buienalarm_regen_dataandsensor.neerslag_buienradar_regen_datato decide whether rain is expected.
Entities sorted by state
Show all entities that match a wildcard * selection. In this case, sensor.*waste_pickup_countdown is sorted by its numeric state. The value behind the number is stored in the unit_of_measurement attribute and is not part of the state itself, otherwise the sort will not work.
See the afvalbeheer page for how to create these countdown sensors instead of showing a date.
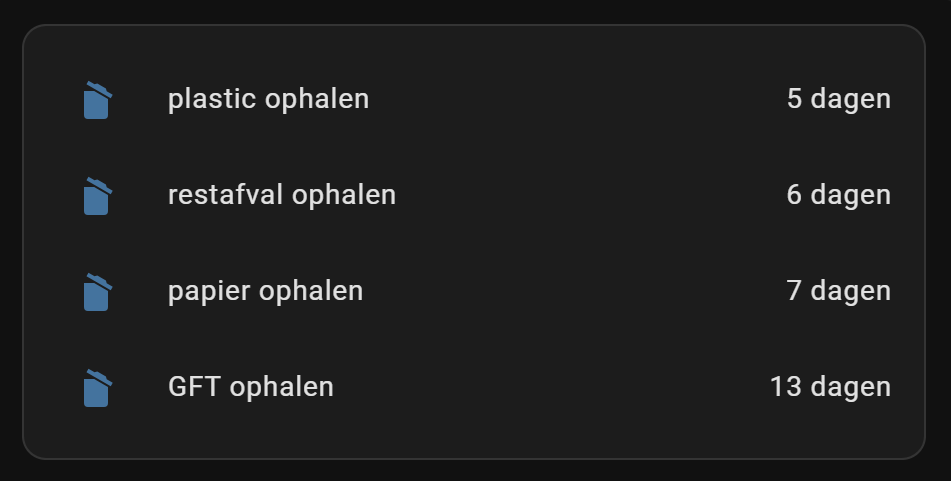
The custom HACS integration auto-entities is used here.
Install this integration via this button in your own Home Assistant instance.
# Sourcecode by vdbrink.github.io
- type: custom:auto-entities
  card:
    type: entities
    show_header_toggle: false
    state_color: false
  filter:
    include:
      - entity_id: sensor.*waste_pickup_countdown
    exclude: null
  show_empty: false
  sort:
    method: state
    numeric: true
Card per room
There are different ways to group entities by subject. One option is to create a separate card for each room. Here is one example:
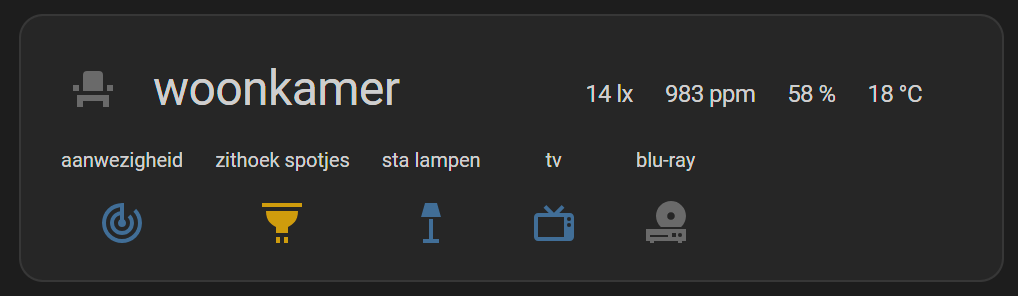
This card is not available by default, but you can install it as the custom HACS integration room-card.
Check the configuration page for all available options.
This is the corresponding YAML for the screenshot.
# Sourcecode by vdbrink.github.io
entity: sensor.living_tv_room_presence
type: custom:room-card
title: woonkamer
icon: mdi:seat
show_icon: true
tap_action:
  action: toggle
info_entities:
  - entity: sensor.living_lux_illuminance_lux
  - entity: sensor.living_co2_value
  - entity: sensor.living_temp_humidity_rounded
  - entity: sensor.living_temp_temperature_rounded
entities:
  - entity: binary_sensor.living_presence_presence
  - entity: light.living_dimmer
  - entity: light.living_group_light
    state_color: true
    tap_action:
      action: more-info
  - entity: binary_sensor.living_tv
    state_color: true
  - entity: binary_sensor.living_blu_ray
    icon: mdi:disc-player
    state_color: true
    show_icon: true
Embed Grafana graph
There is a dedicated Home Assistant dashboard: Grafana integration page that shows how to integrate Grafana graphs into your Home Assistant dashboard.
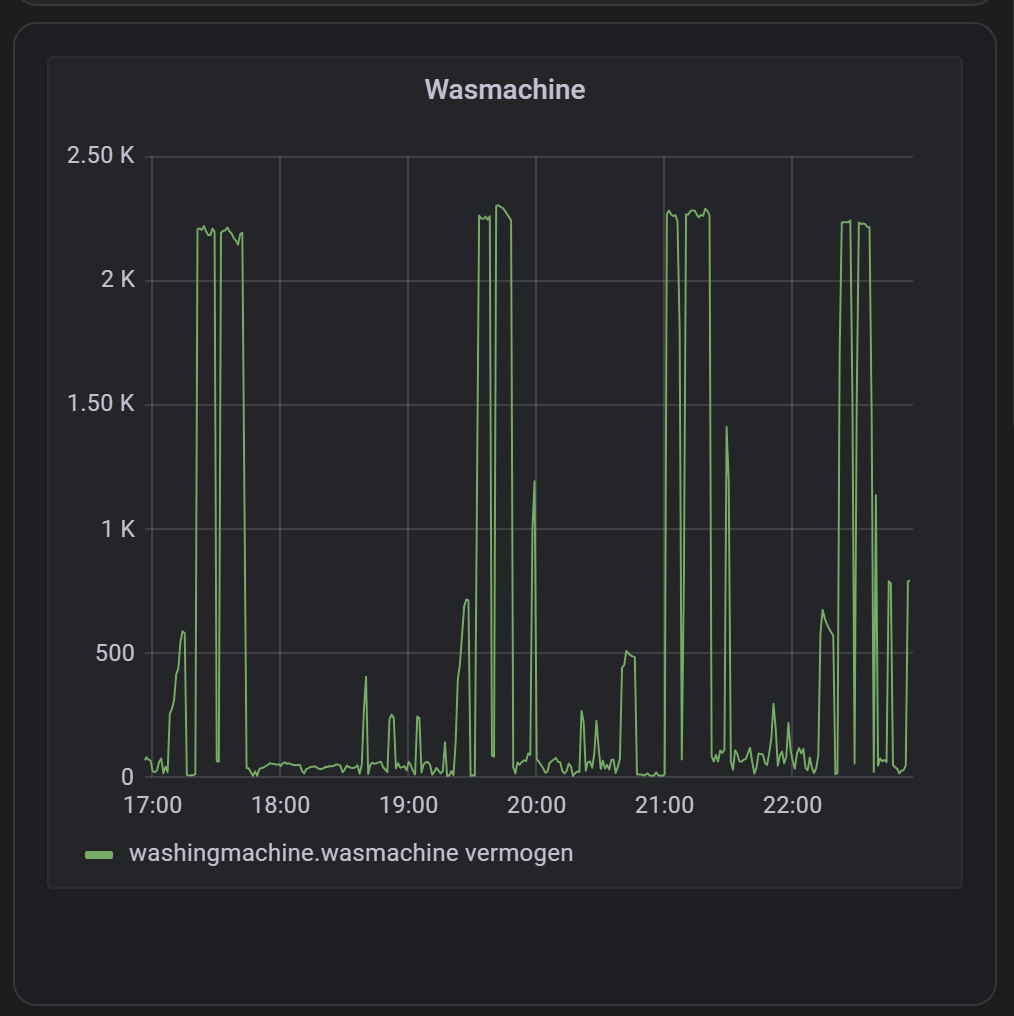
You need to enable iframe access in Grafana, and then you can include a graph via an iframe or web card in Home Assistant.
Read all about it on the dedicated page.
« See also my other Home Assistant tips and tricks
^^ Top | Homepage | Best Buy Tips | Automation Ideas | Blog posts