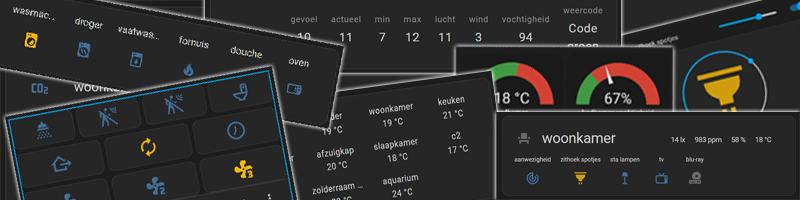
Home Assistant dashboard: Examples overview
![]()
Here you find a visual elements overview of Home Assistant dashboard elements on this site.
Click on the screenshot to go to the section where this is described.
I hope you can use the examples for your own dashboard!
NOTE: For some of the examples here, you need to install first an extra HACS integration.
Table of Contents
Date and time
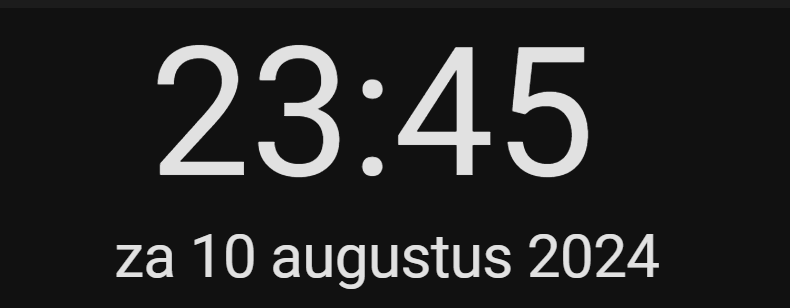
Example with time and date (in Dutch).
Weather
Predictions
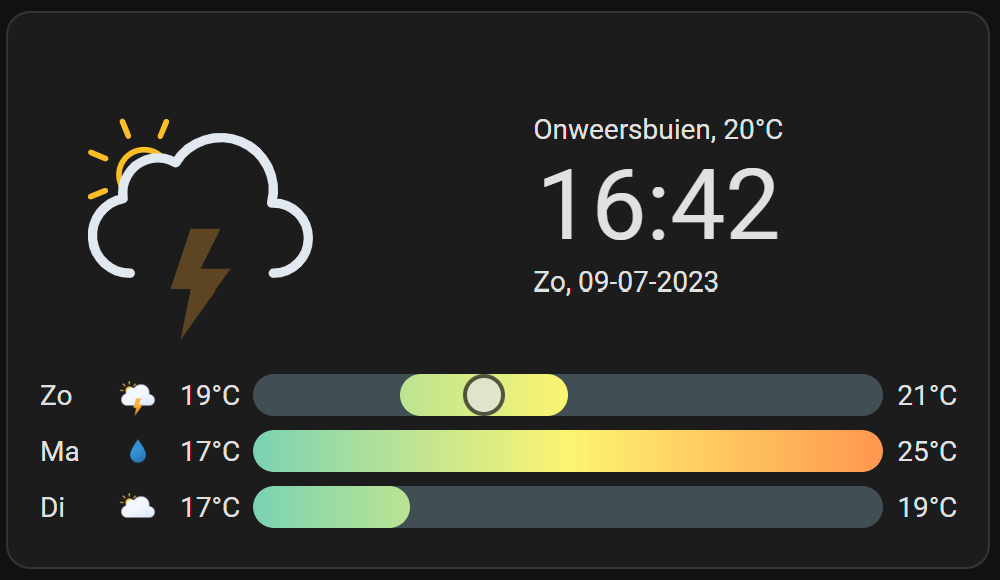
Current type of temperature and forecast for three days.
or
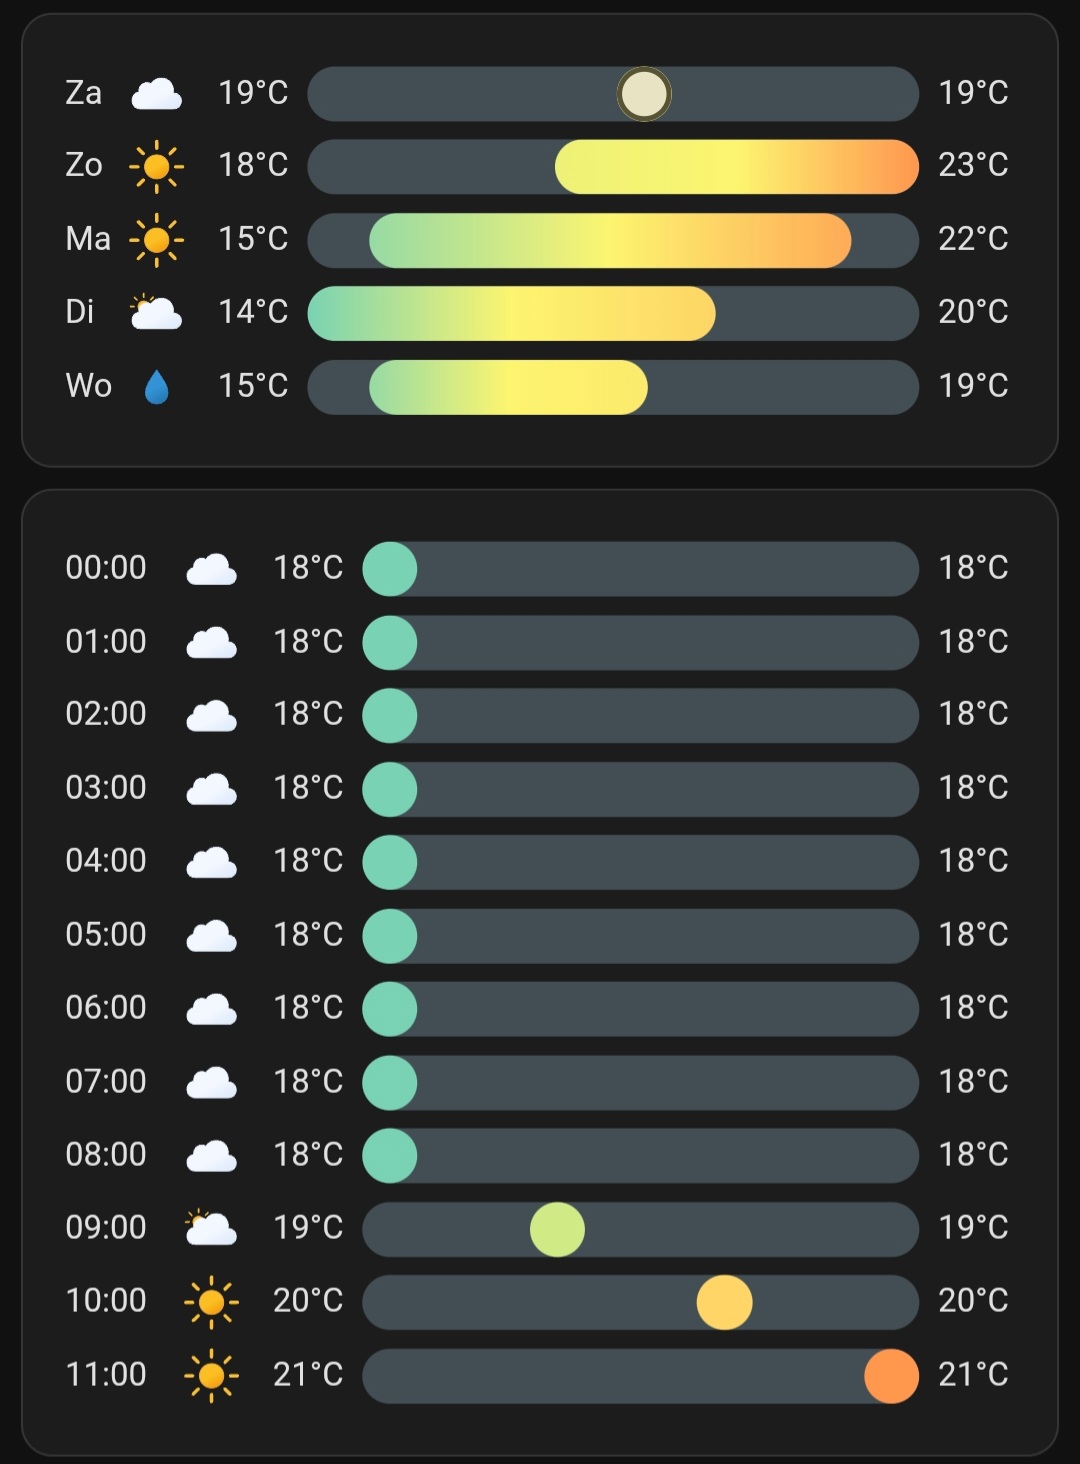
Forecast for five days and the upcoming twelve hours.
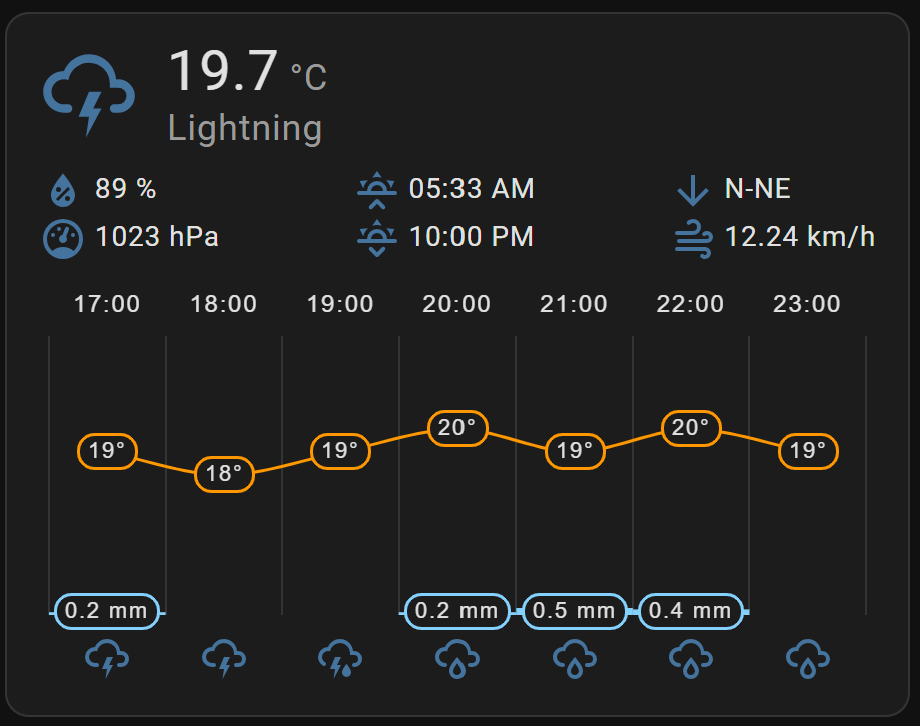
Forecast with temperature and rain per hour.
Thunder
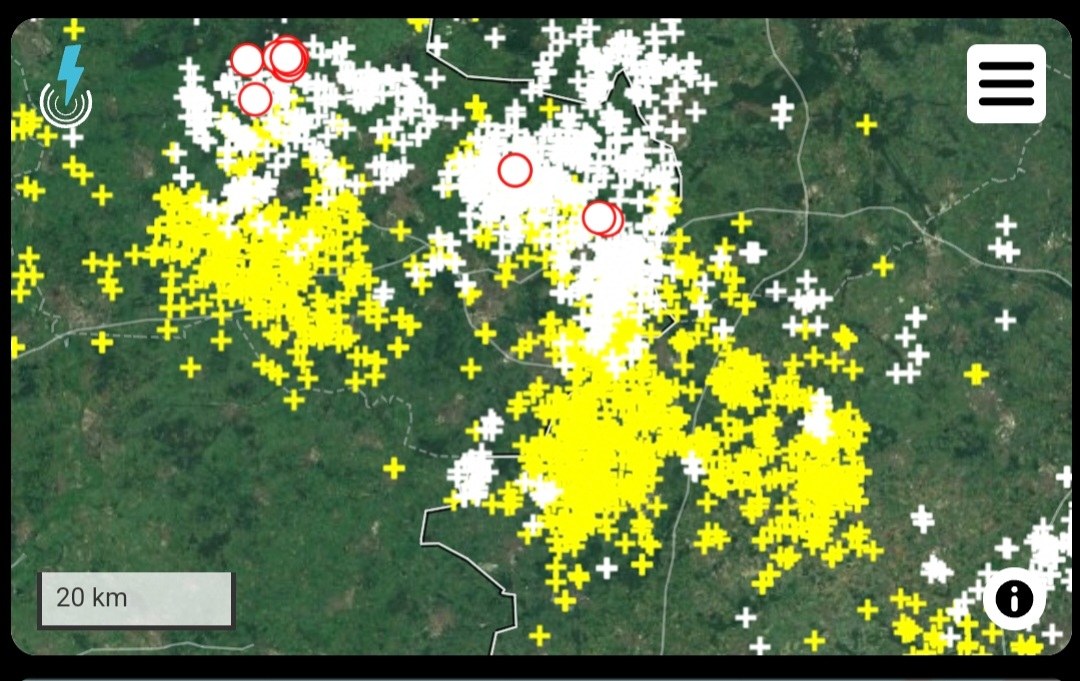
Actual lightning and thunder overview.
Weather in The Netherlands
Rain

Forecast for rain intensity over time.
Animated rain forecast over The Netherlands. With marker for your home town.
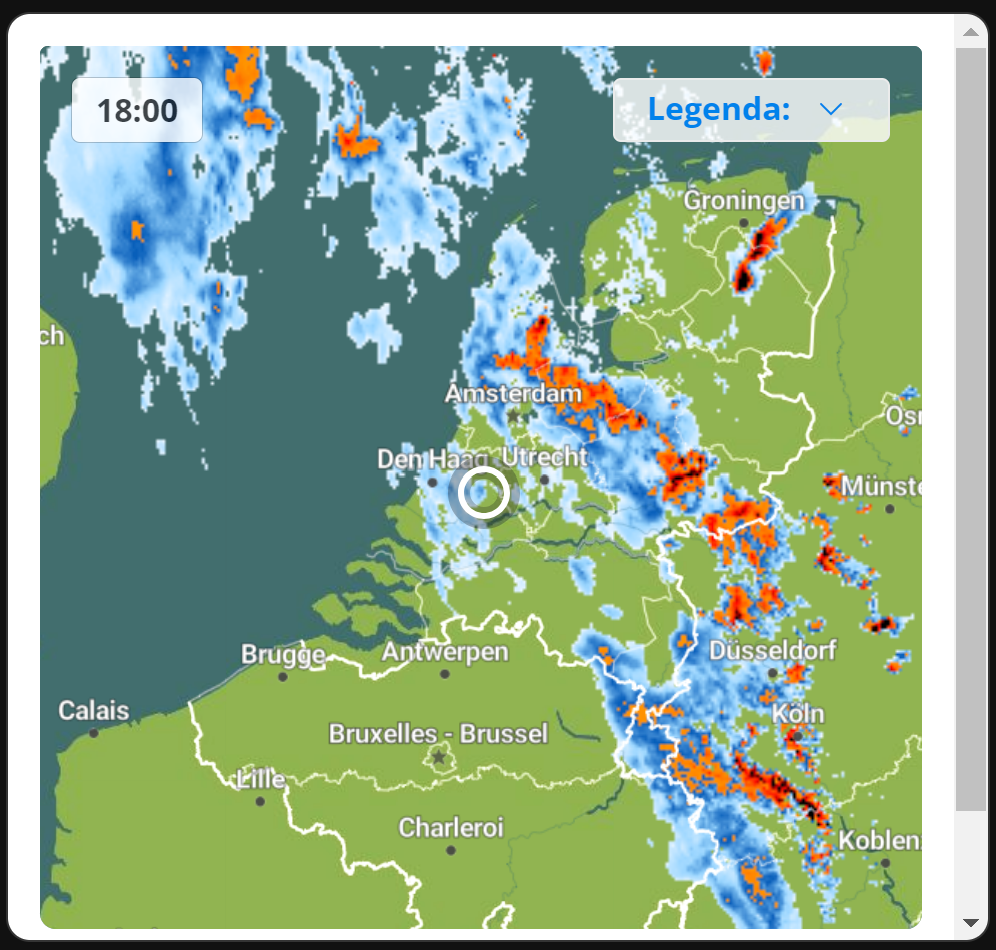
Other animated rain forecast.
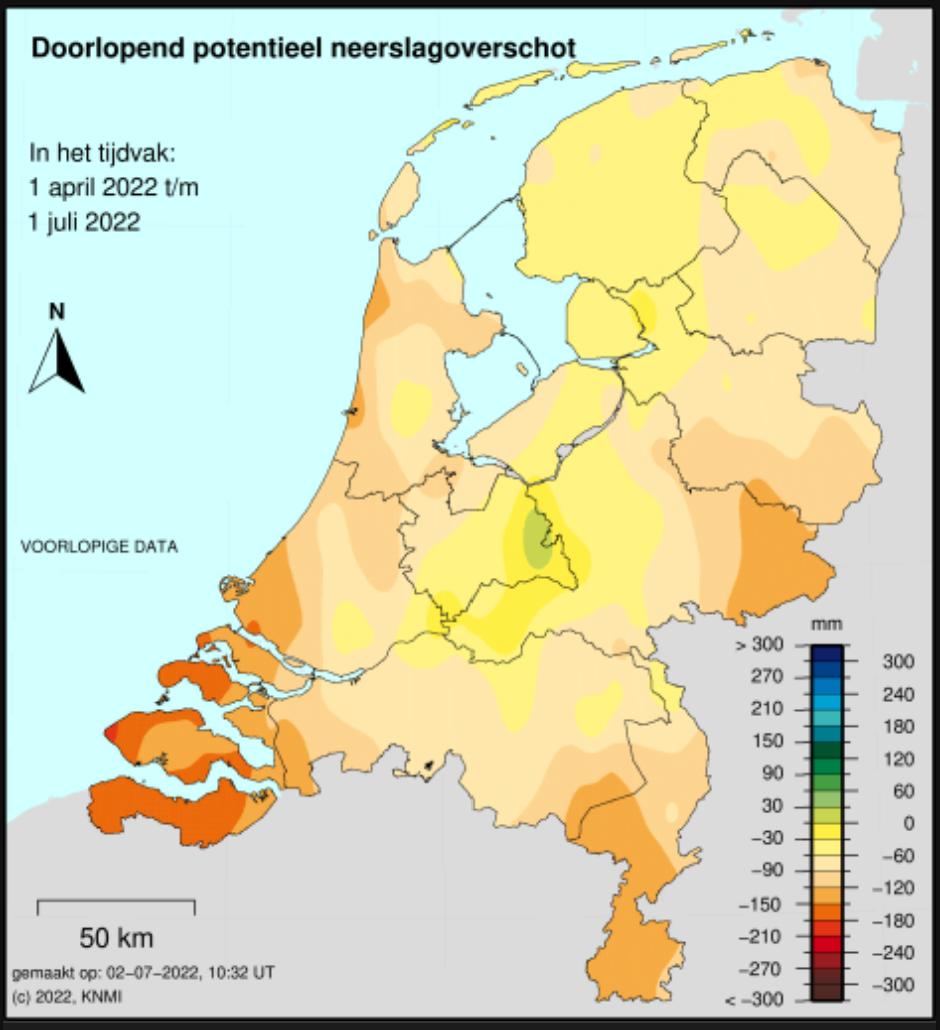
Amount of fallen rain in The Netherlands.
Score
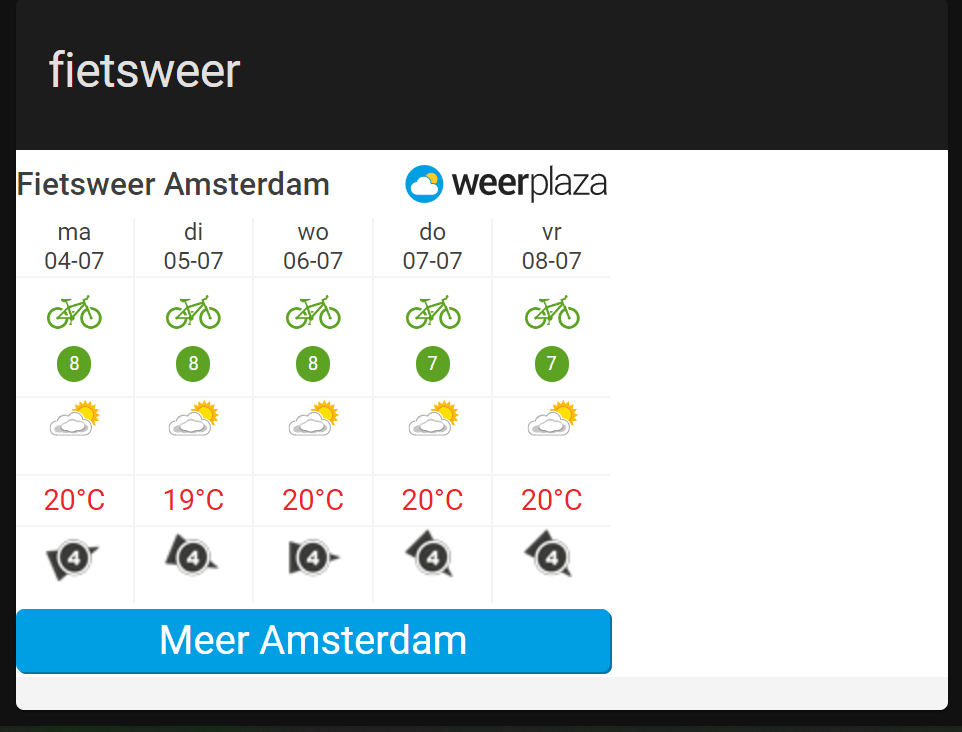
Weather scores per day for different type of sports activities. Like cycling.
Weather alarm
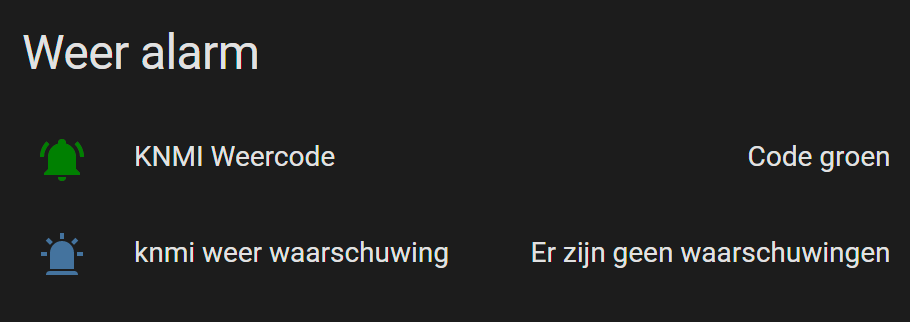
Weather alarm color and text based on the Dutch KNMI data.
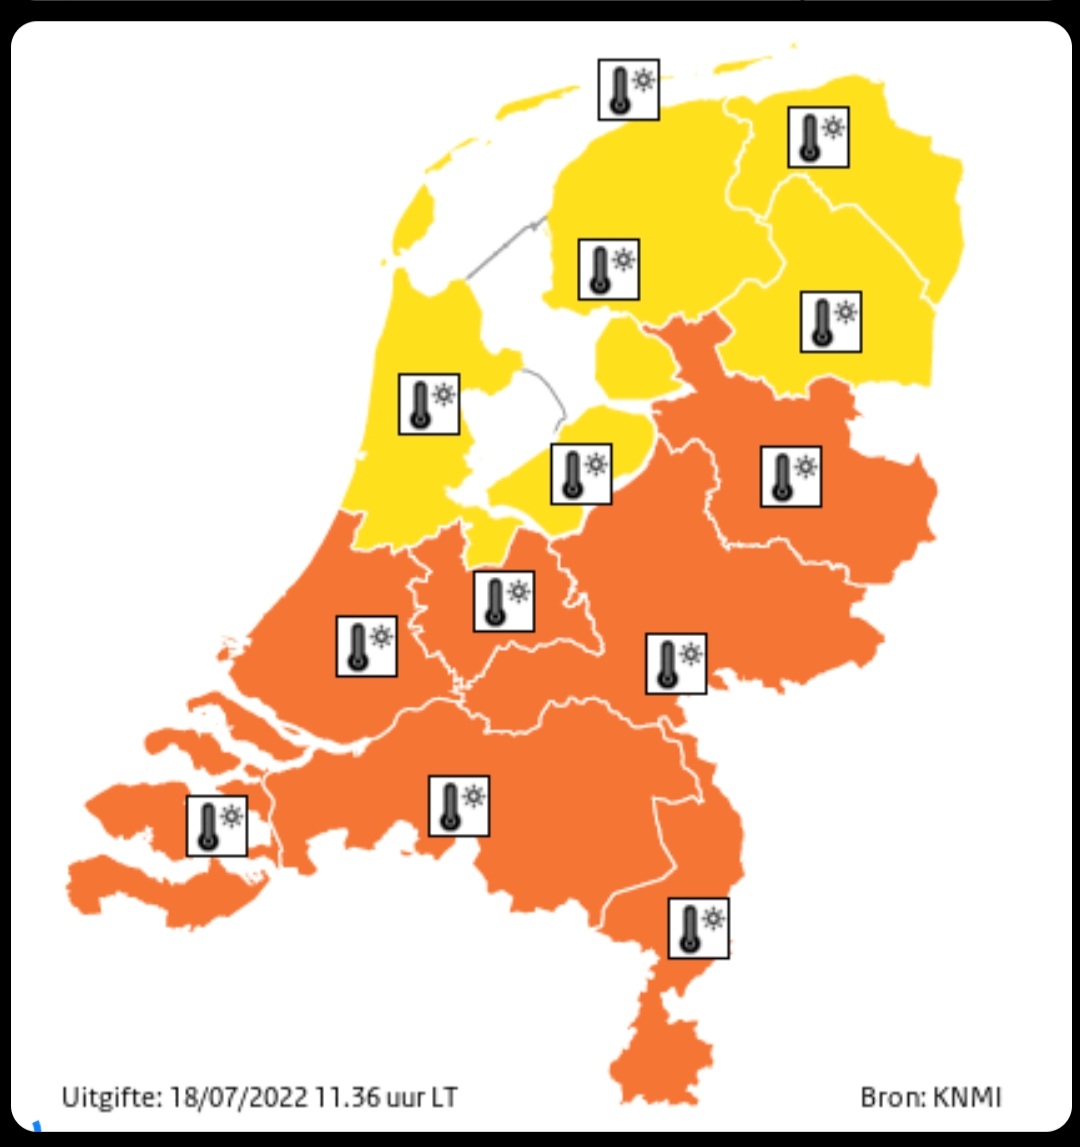
Map of the Netherlands with weather alarms per province.
Pollen
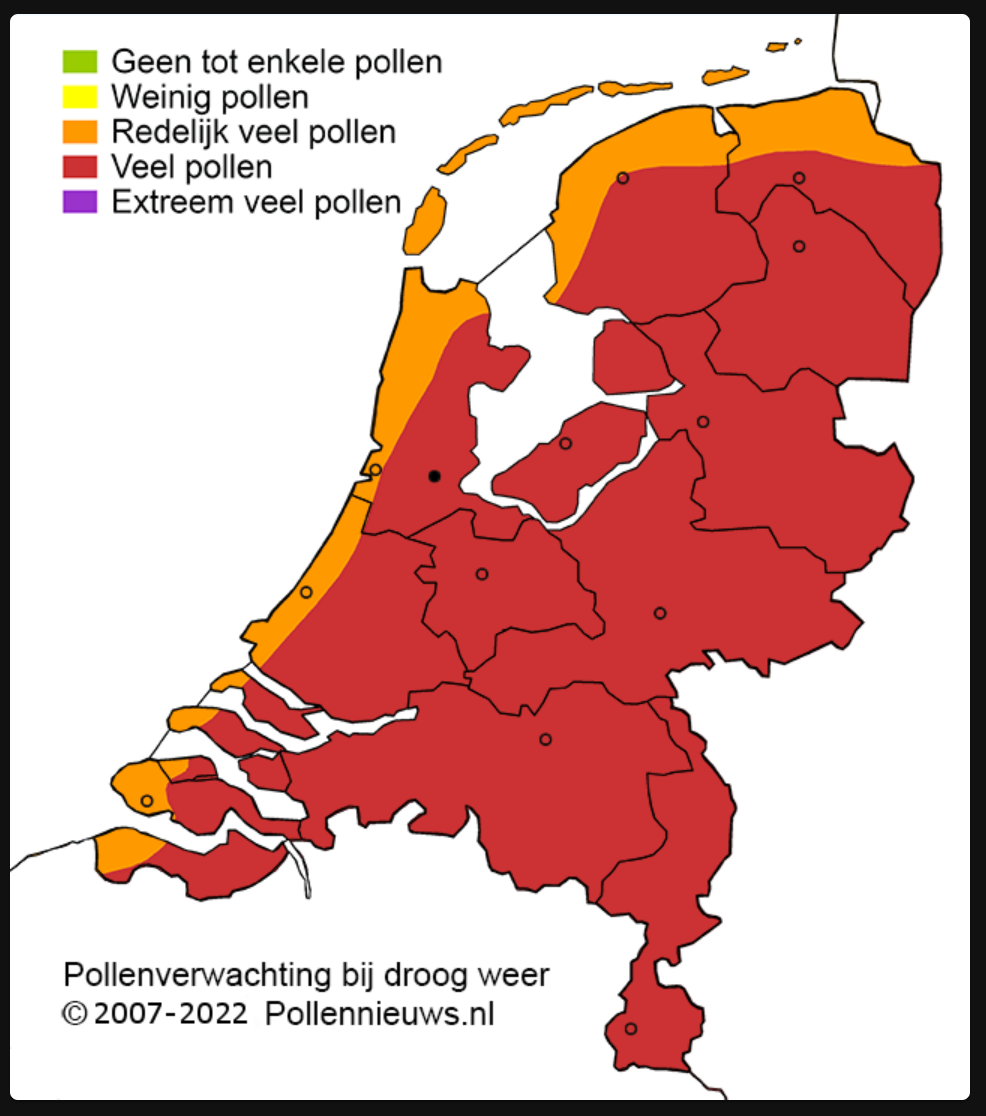
Map of the Netherlands with pollen level per region.
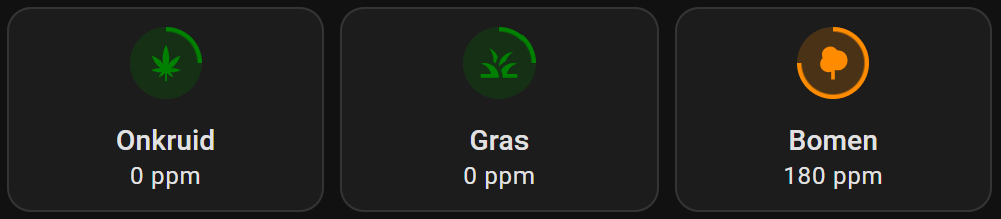
Pollen levels for weed, grass and trees.
Afvalbeheer Integration
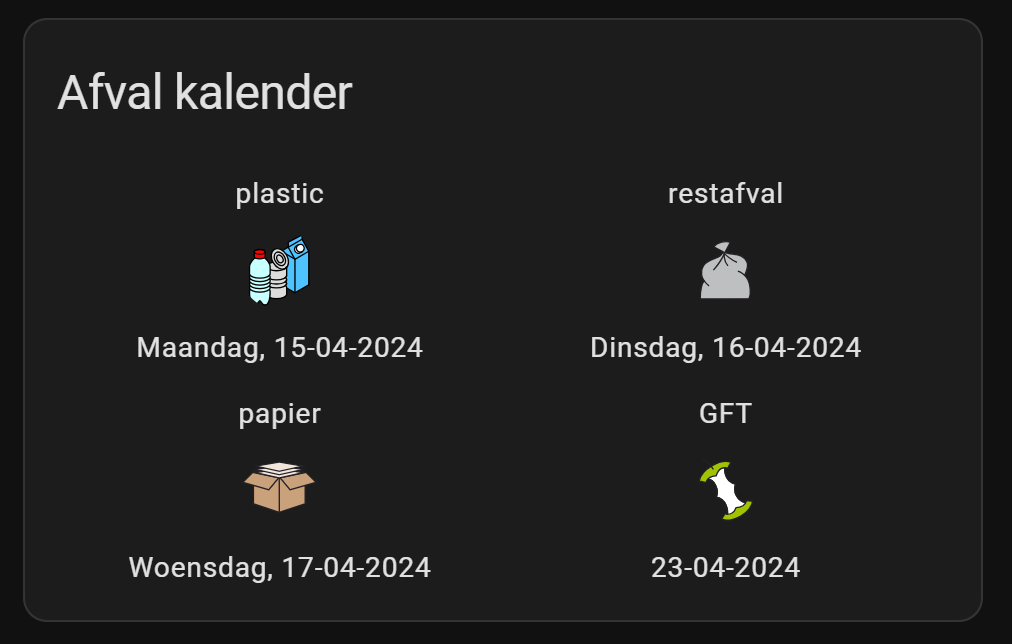
Different kinds of presentations to show the upcoming trash can pick-up days, based on the Afvalbeheer integration.
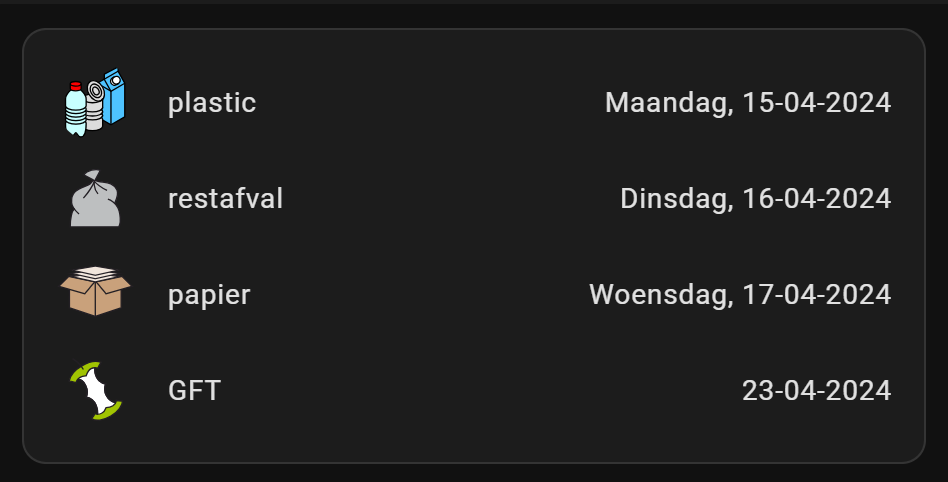
The default presentation.
![]()
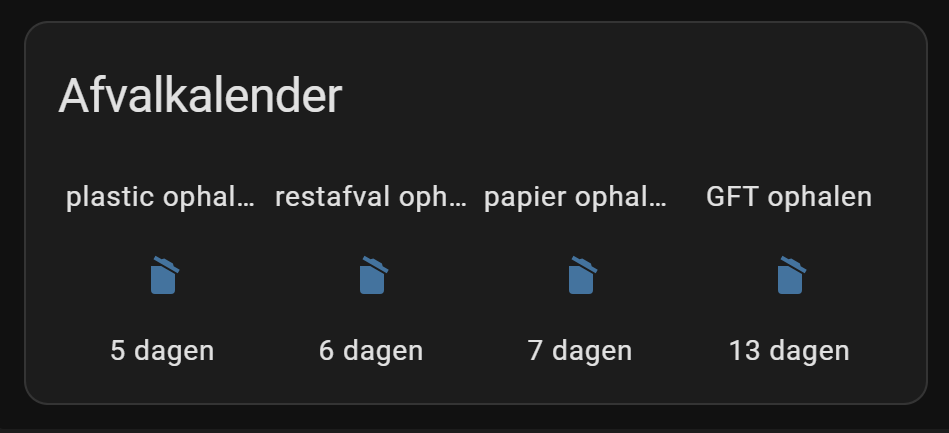
Ordered by date in a row.
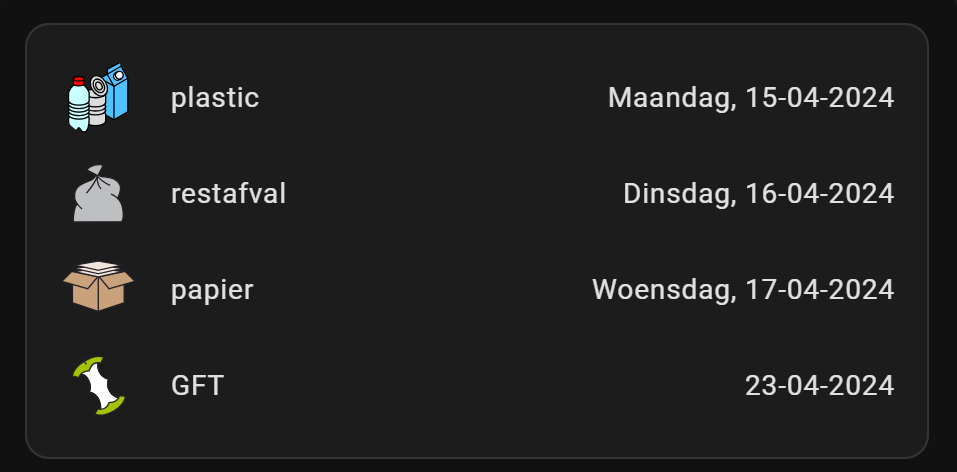
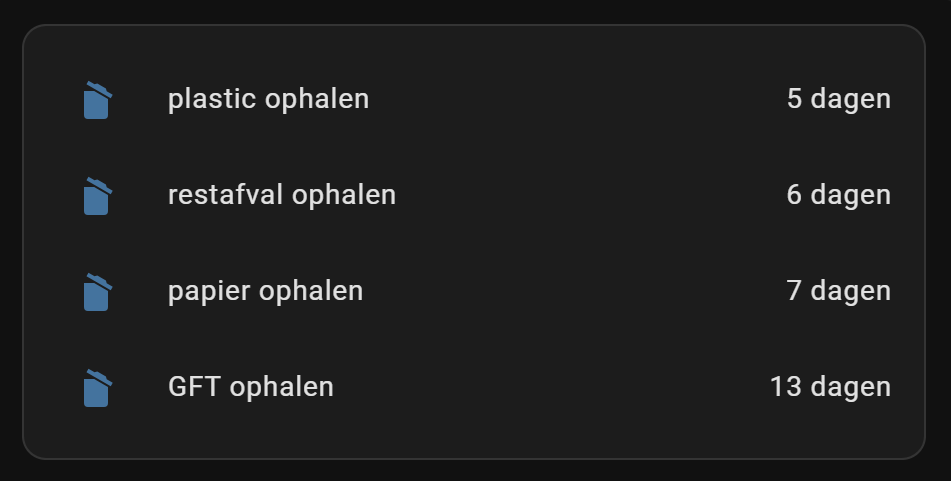
Ordered by date in a list.
![]()
Ordered by date in a list with days count down.
In a 2x2 raster.
In a row with a basic icon.
In a row with a basic icon.
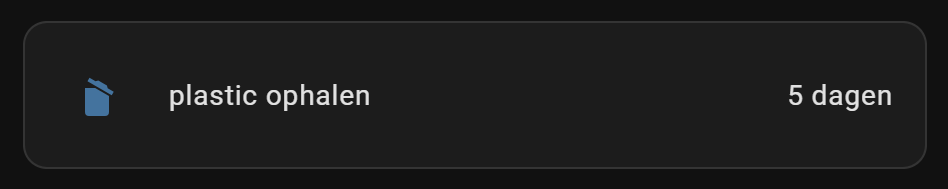
Show only the pickup days within the upcoming 5 days.
Mushroom icon with matching color indicating which trash can must be handled today or tomorrow.
^^ Top | Homepage | Best Buy Tips | Automation Ideas | Blog posts